TROPICAL RAINFORESTS: Disappearing Opportunities
Carbon Dioxide Emissions Charts, 2005
Individual country data|
|
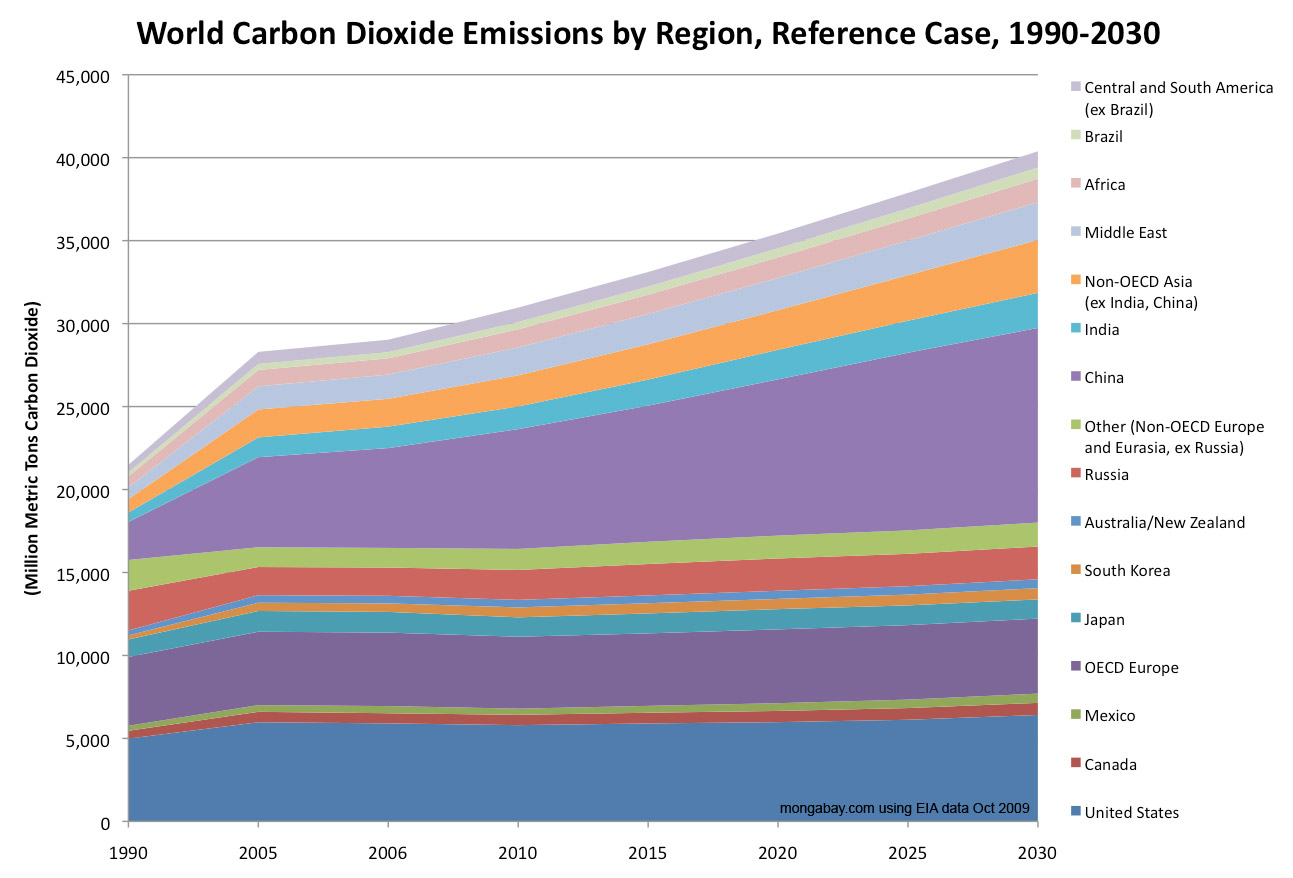
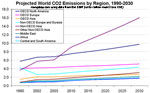
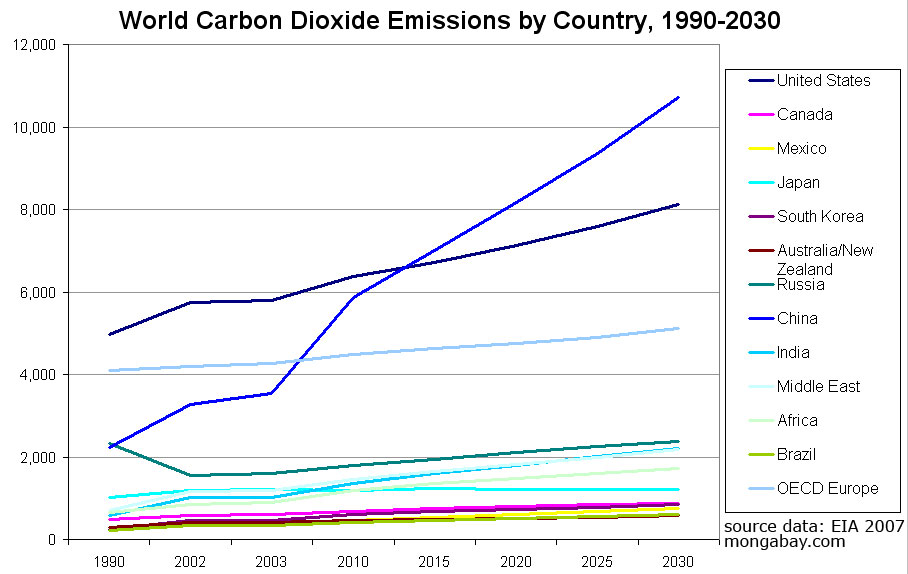
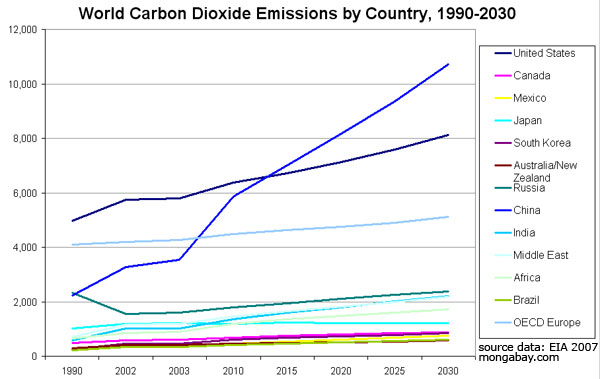
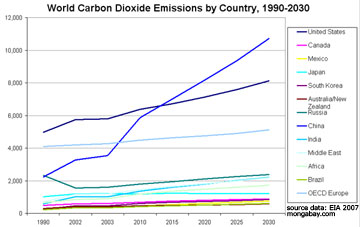
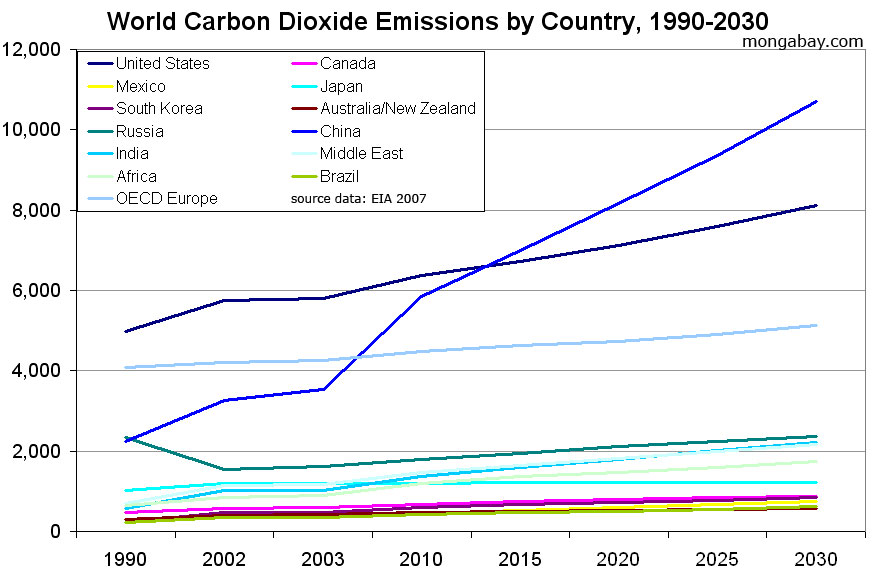
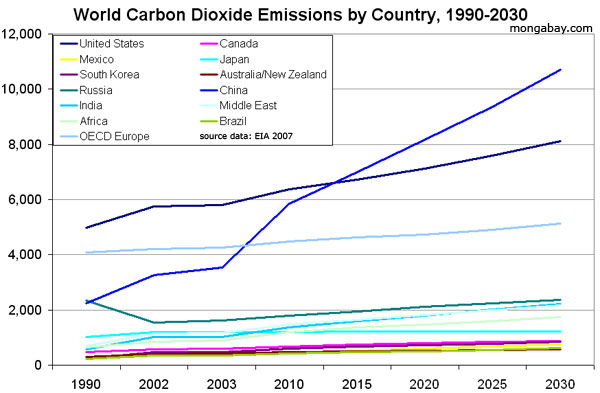
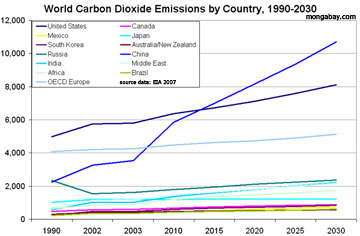
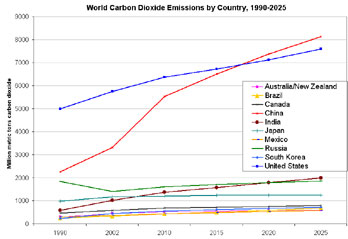
According to the Energy Information Administration, after China and the United States, among major polluters only India is expected to have significant growth of emissions over the next 20 years.
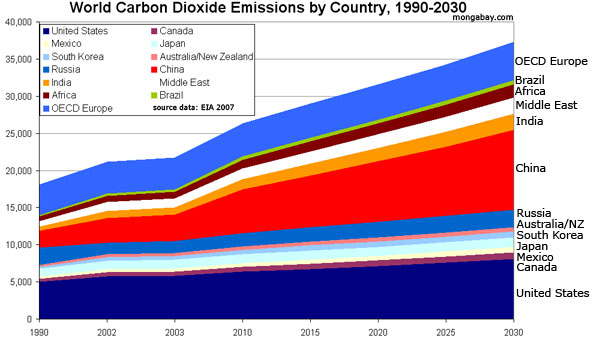
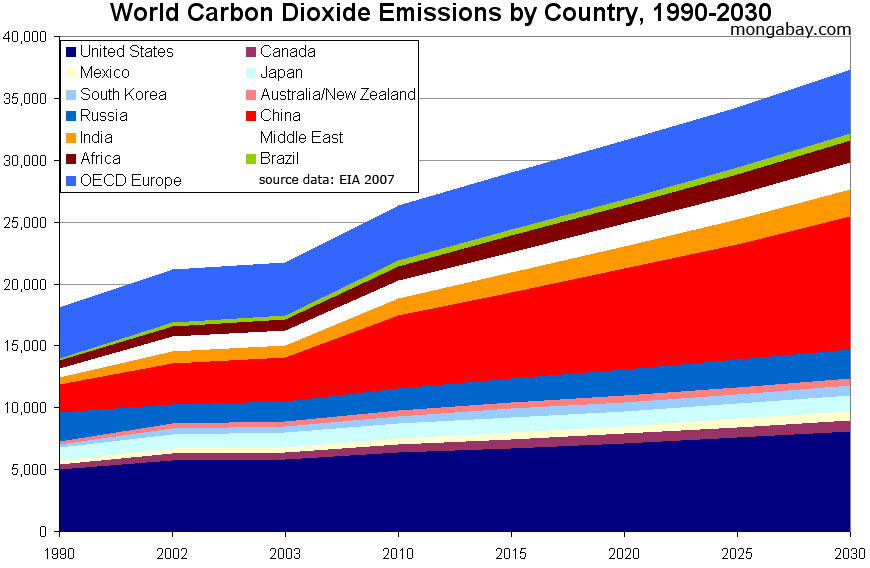
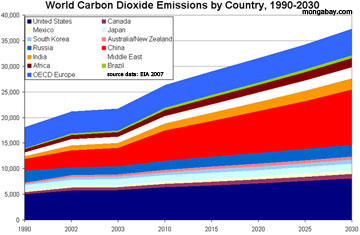
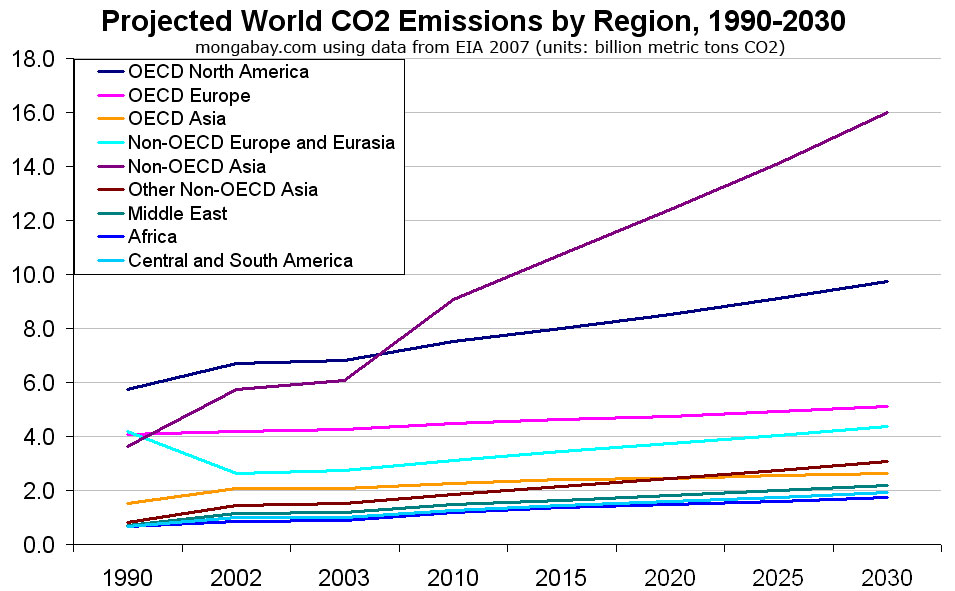
Carbon Dioxide Emissions by Country, 1990-2030
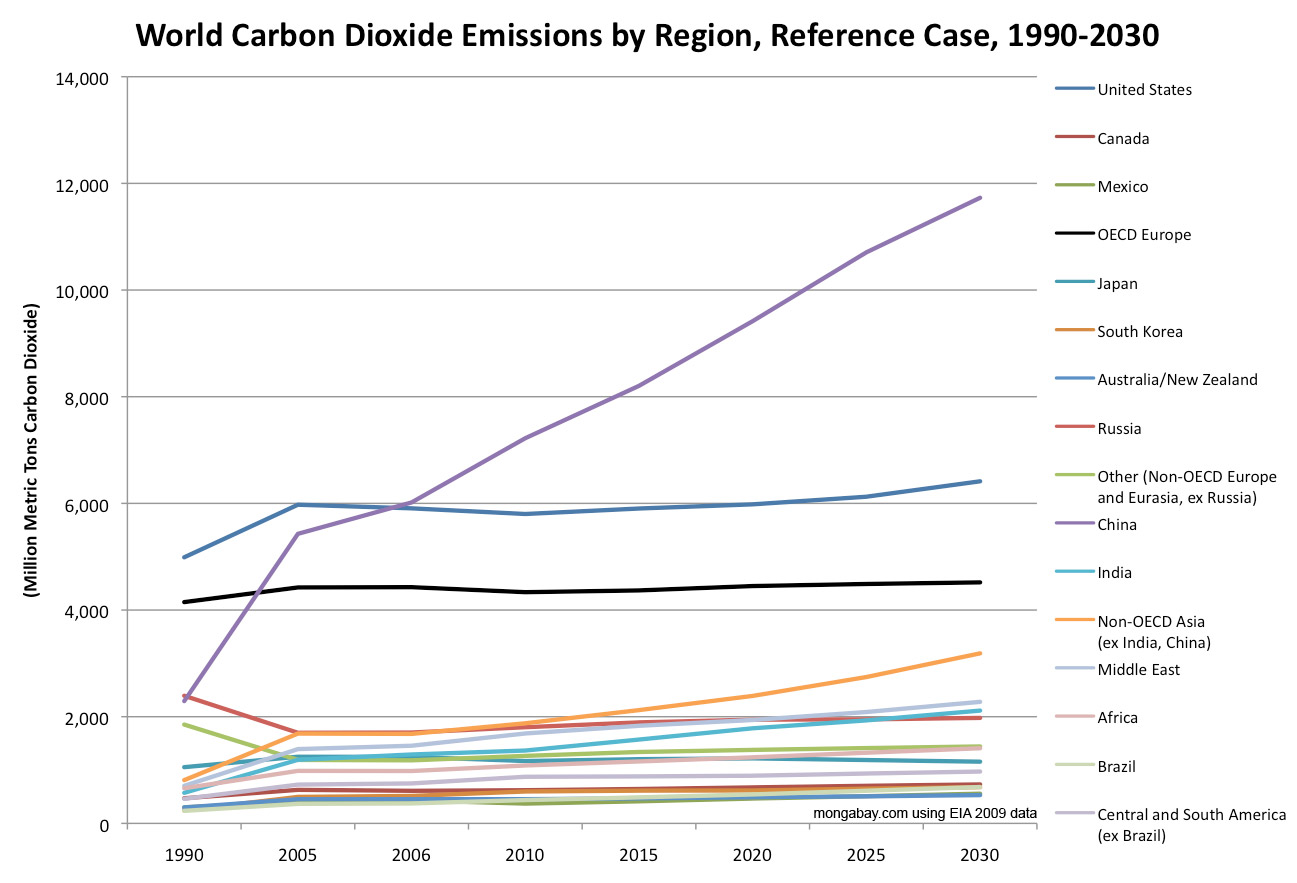
According to the Department of Energy's (DOE) Energy Information Administration (EIA), after China and the United States, among major polluters only India is expected to have significant growth of emissions over the next 20 years.
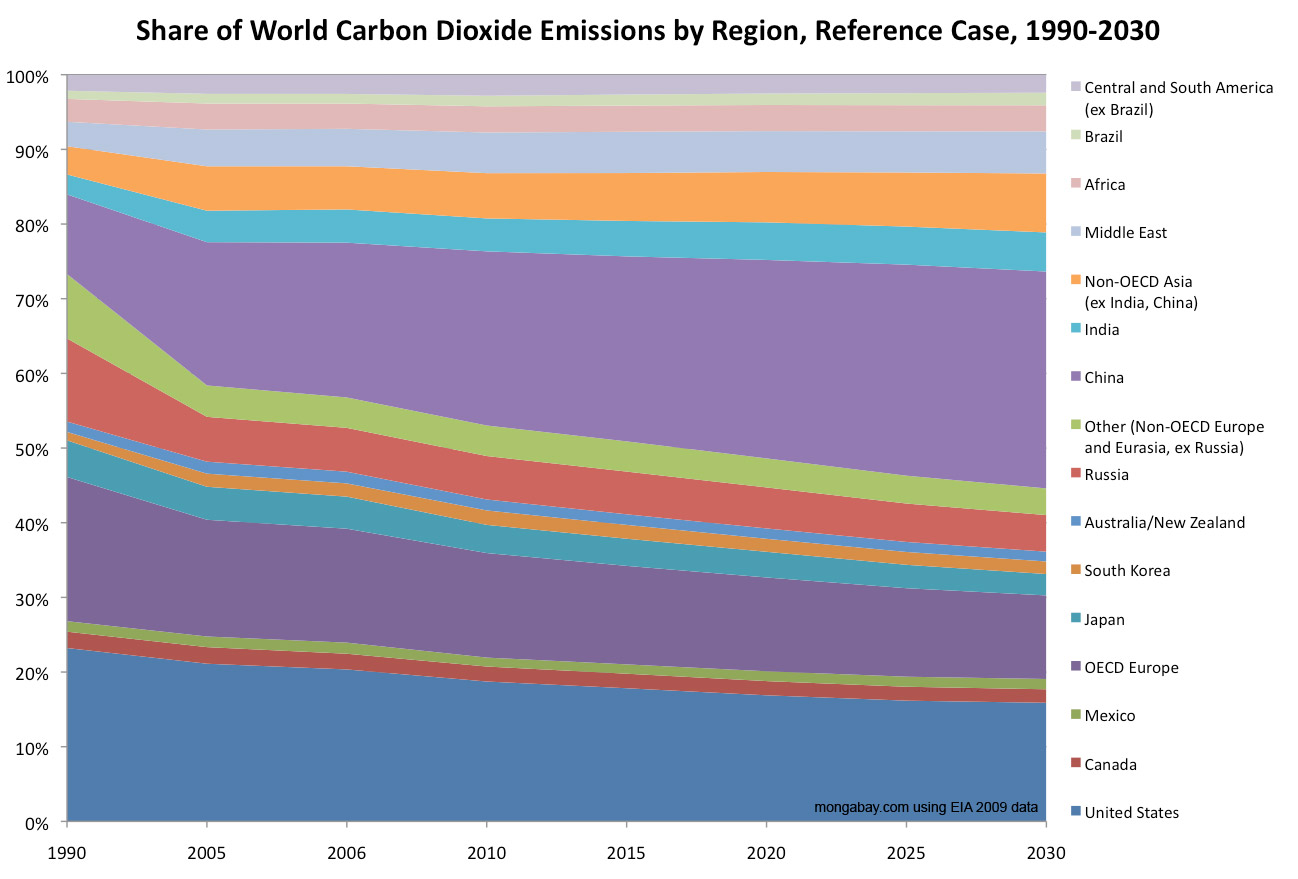
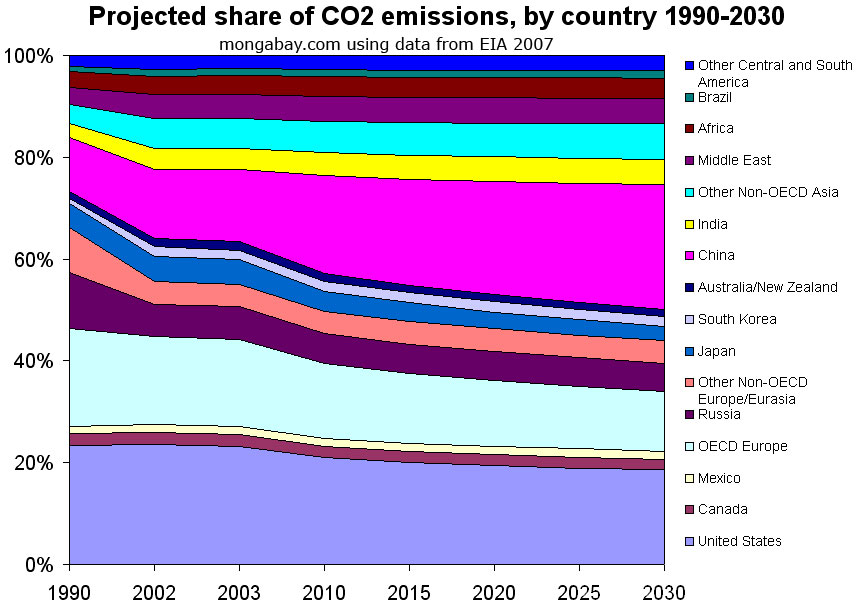
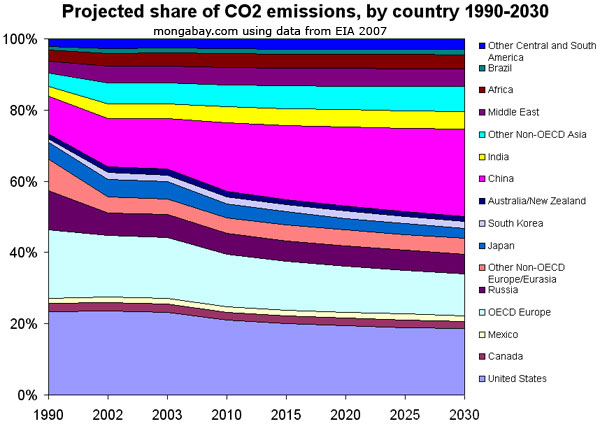
Share of Carbon Dioxide Emissions by Country/Region, 1990-2030
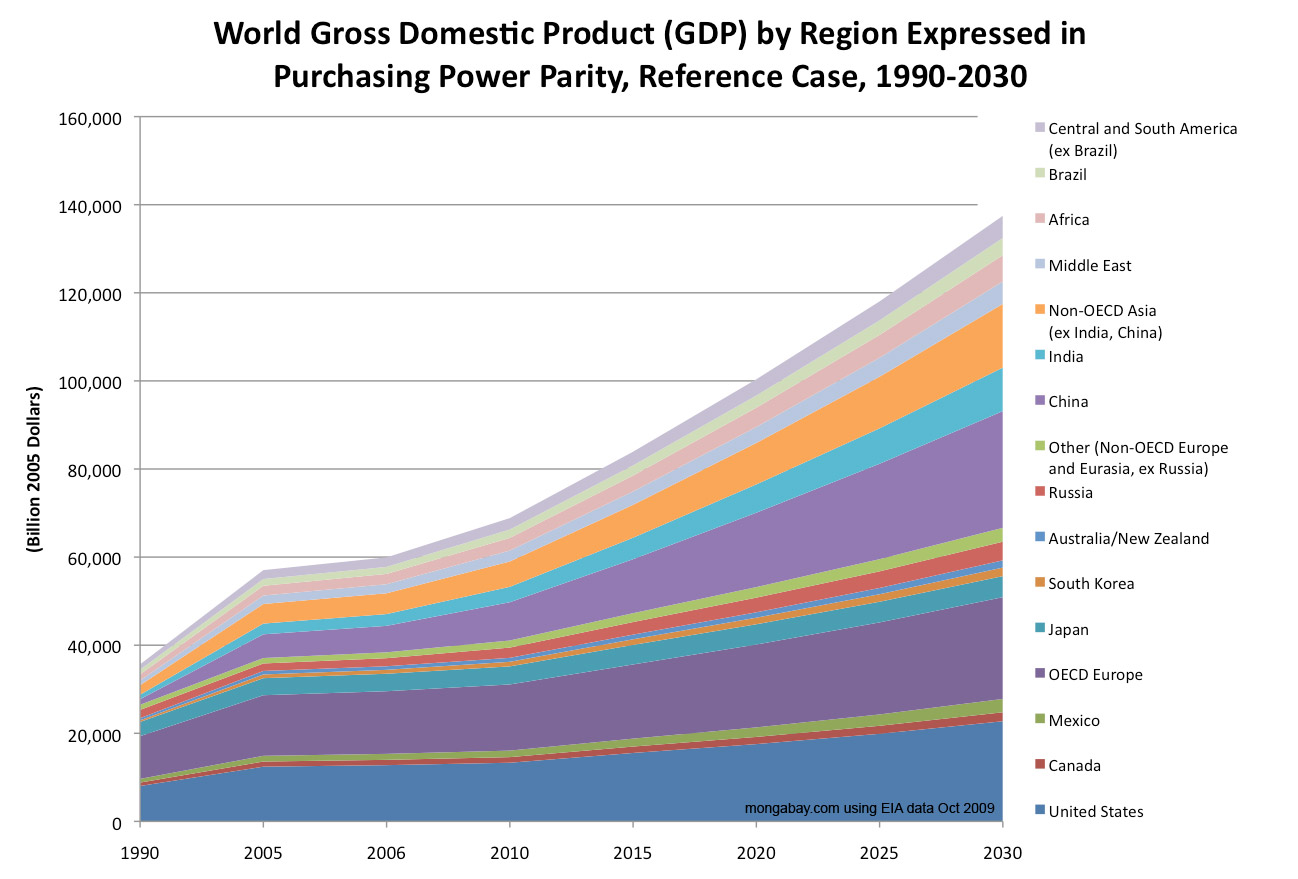
World Gross Domestic Product (GDP) by Region Expressed in Purchasing Power Parity, Reference Case, 1990-2030 [line chart/graph]

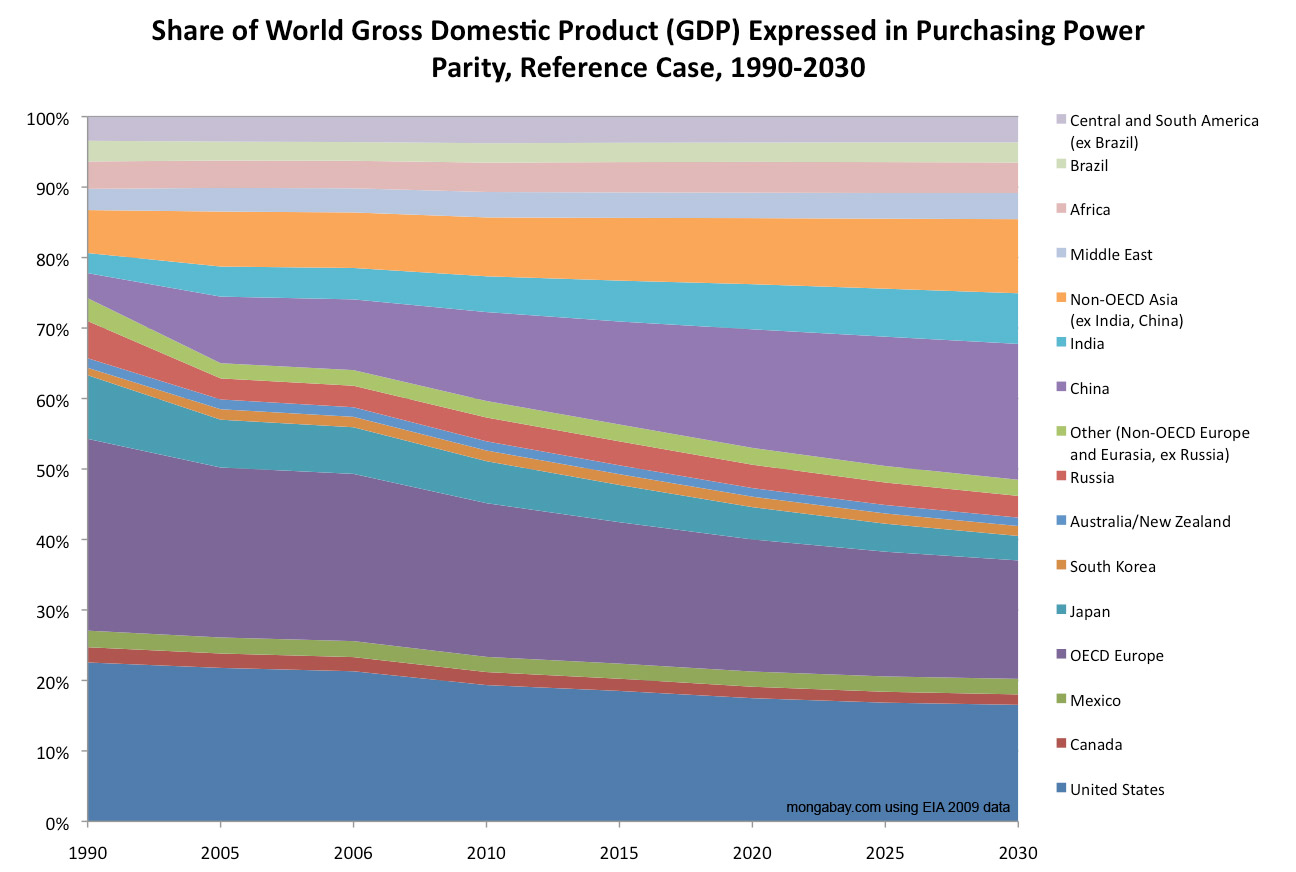
World Gross Domestic Product (GDP) by Region Expressed in Purchasing Power Parity, Reference Case, 1990-2030 [area chart/graph]
Share of World Gross Domestic Product (GDP) by Region Expressed in Purchasing Power Parity, Reference Case, 1990-2030 [line chart/graph]
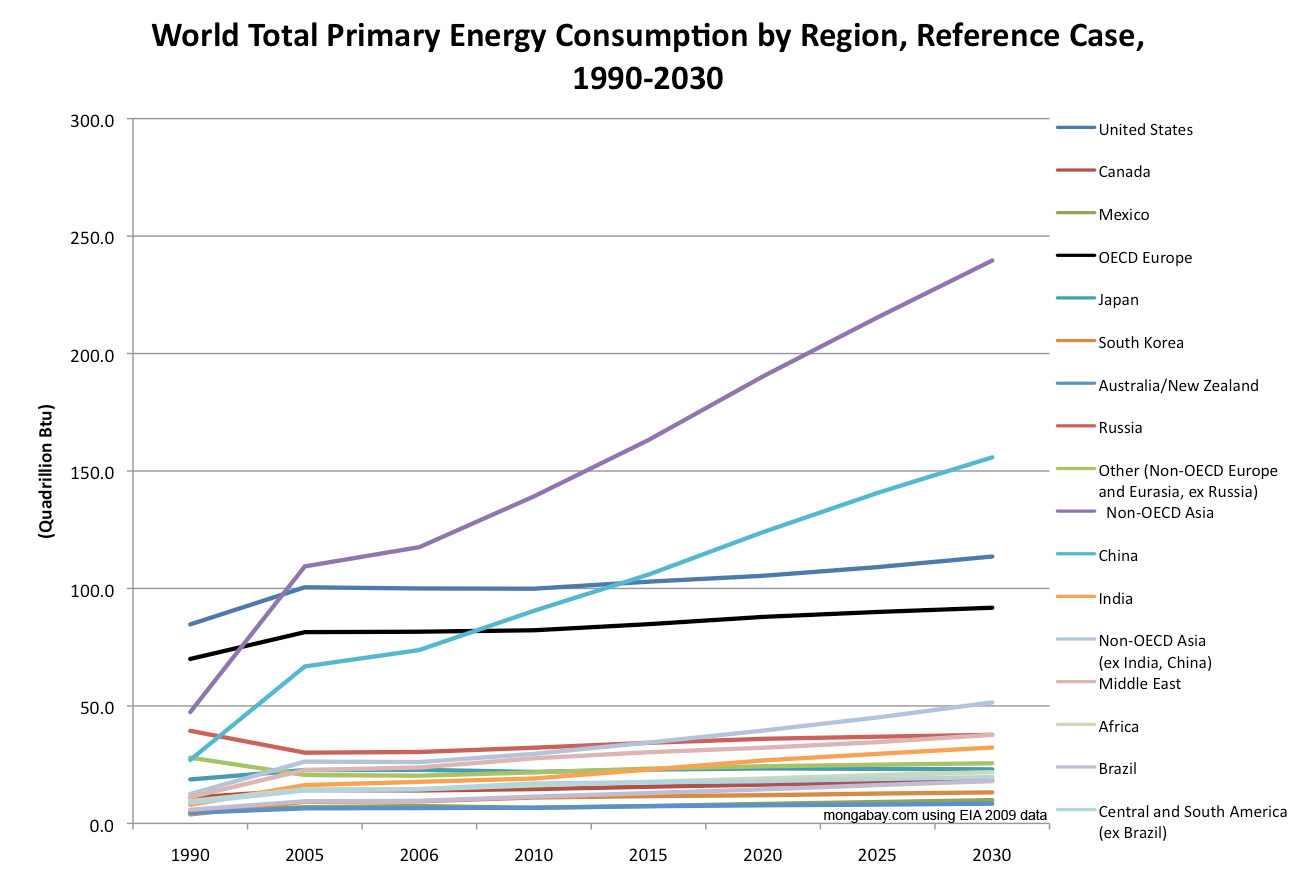
World Total Primary Energy Consumption by Region, Reference Case, 1990-2030 (Quadrillion Btu) [line chart]
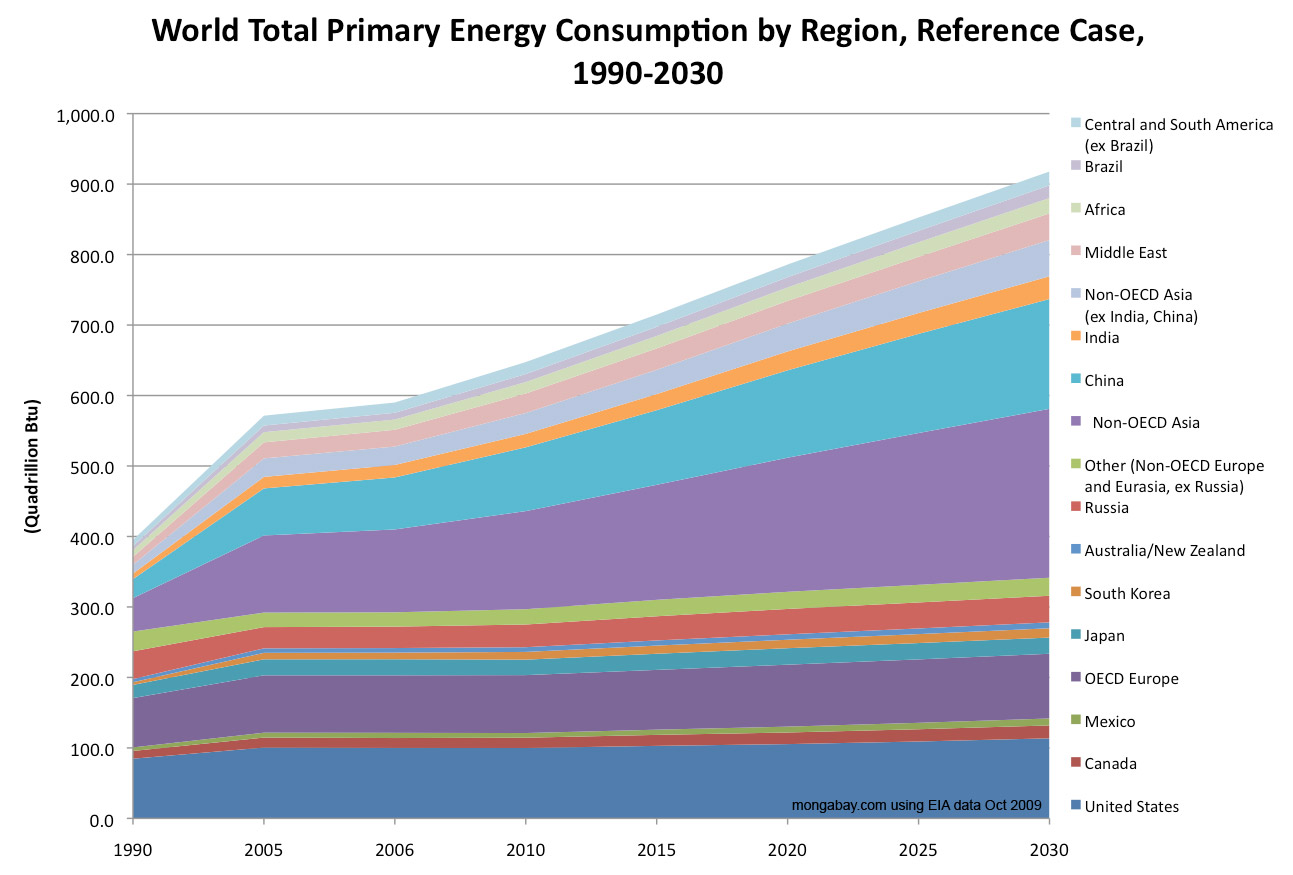
World Total Primary Energy Consumption by Region, Reference Case, 1990-2030 (Quadrillion Btu) [area chart]
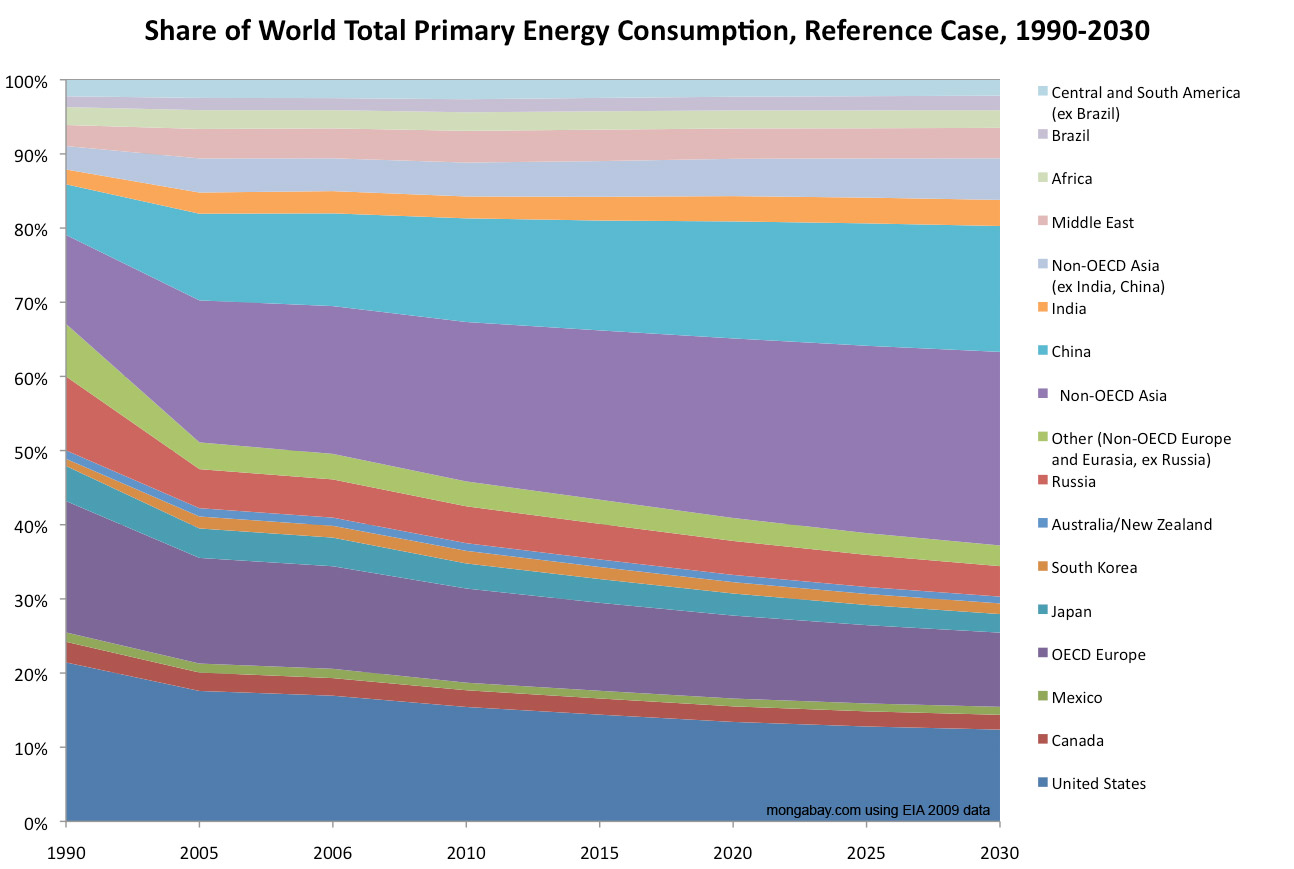
Share of World Total Primary Energy Consumption by Region, Reference Case, 1990-2030 (Quadrillion Btu)
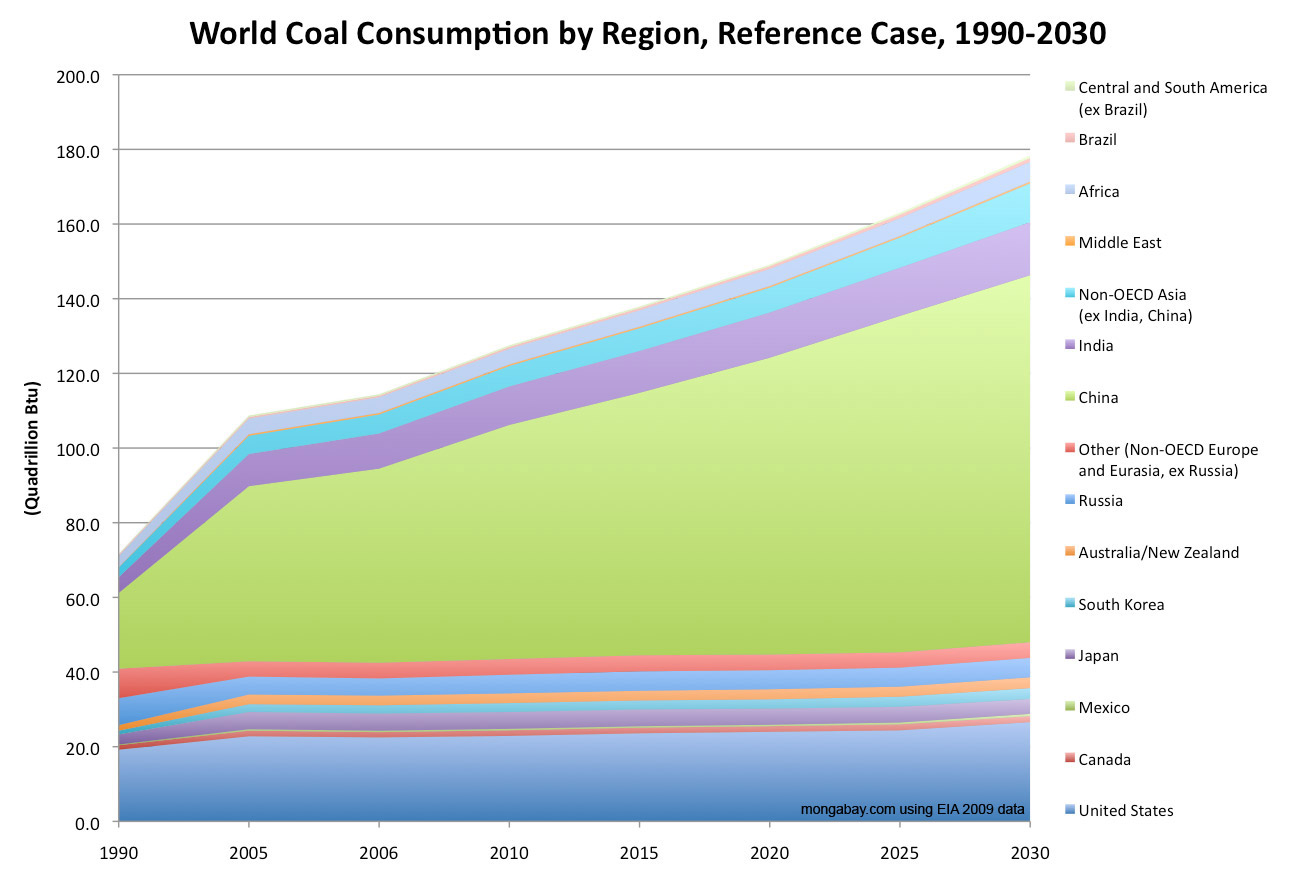
World Coal Consumption by Region, Reference Case, 1990-2030 [context]
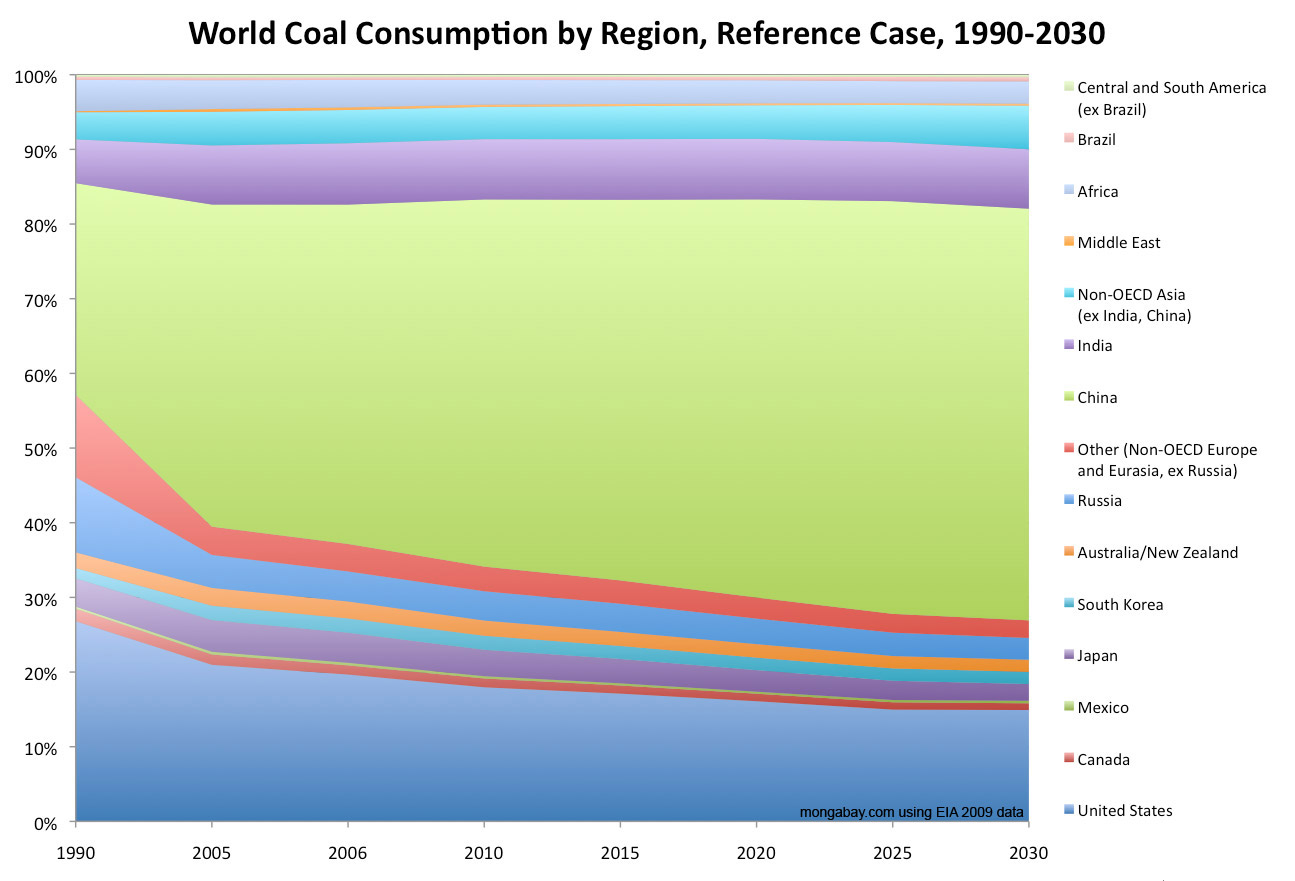
Share of World Coal Consumption by Region, Reference Case, 1990-2030
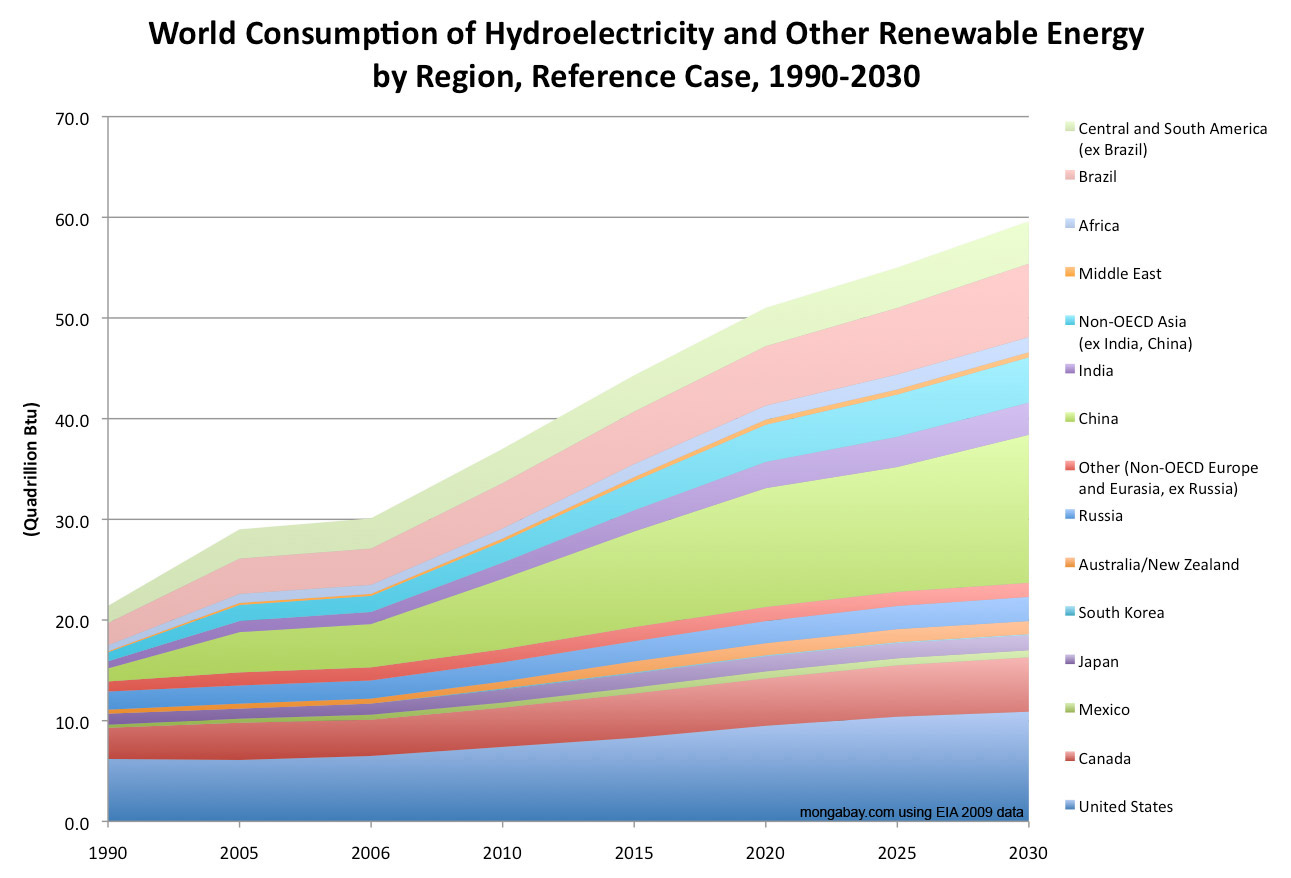
World Consumption of Hydroelectricity and Other Renewable Energy by Region, Reference Case, 1990-2030 [context]
Share of World Consumption of Hydroelectricity and Other Renewable Energy by Region, Reference Case, 1990-2030

World Nuclear Energy Consumption by Region, Reference Case, 1990-2030 [context]
Share of World Nuclear Energy Consumption by Region, Reference Case, 1990-2030
Carbon Dioxide Emissions by Market, 1990-2025
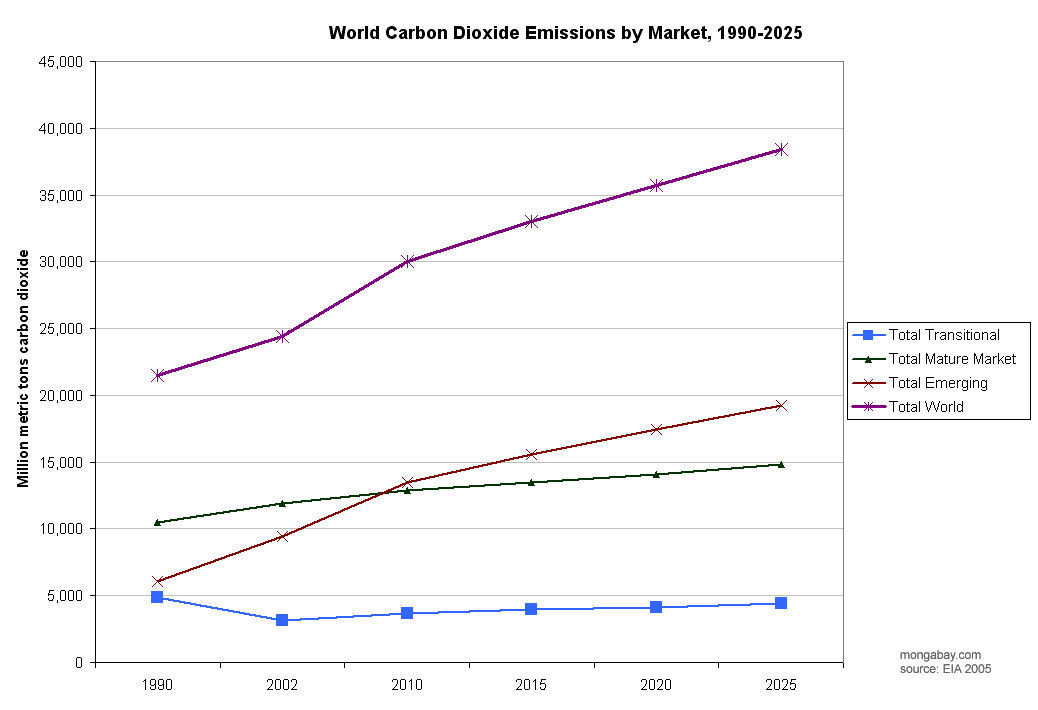
Emerging markets will have the largest growth in CO2 emissions over the next twenty years according to the Energy Information Administration's Emissions of Greenhouse Gases in the United States 2004.
Carbon Dioxide Emissions by Region, 1990-2025
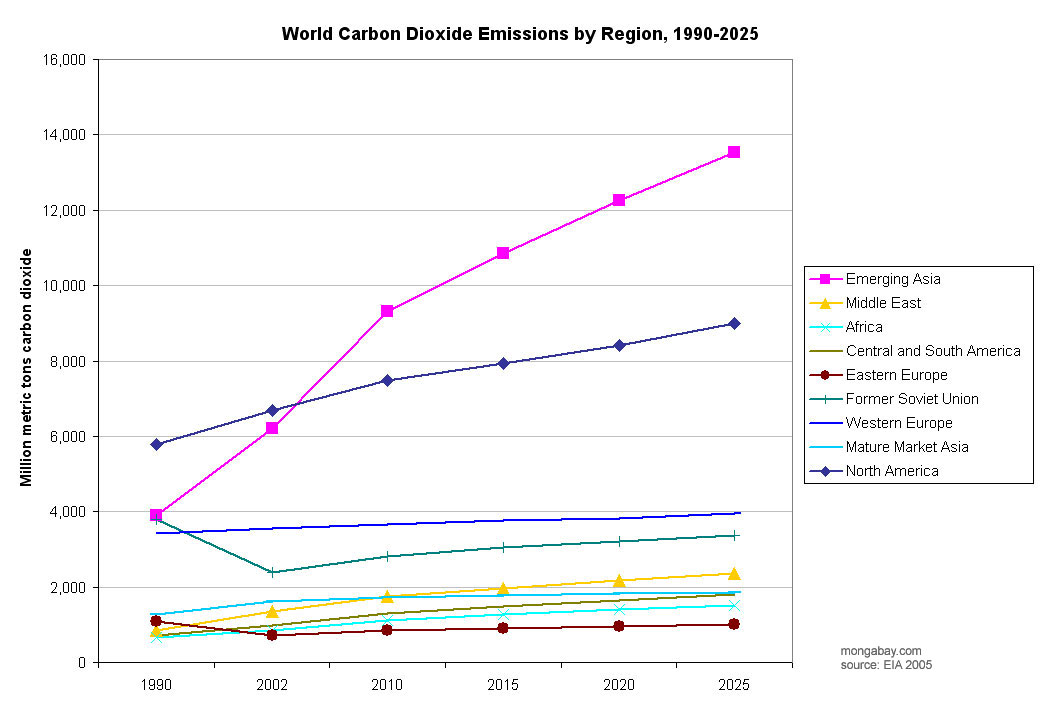
Led by China and India, carbon dioxide emissions are expected to surge in Asia over the next twenty years according to the Energy Information Administration's Emissions of Greenhouse Gases in the United States 2004. EIA projections show a leveling off of carbon dioxide emissions in other regions, except for North America where CO2 emissions will continue to increase at a steady rate.
U.S. Energy Use by End-Use Sector, 2004
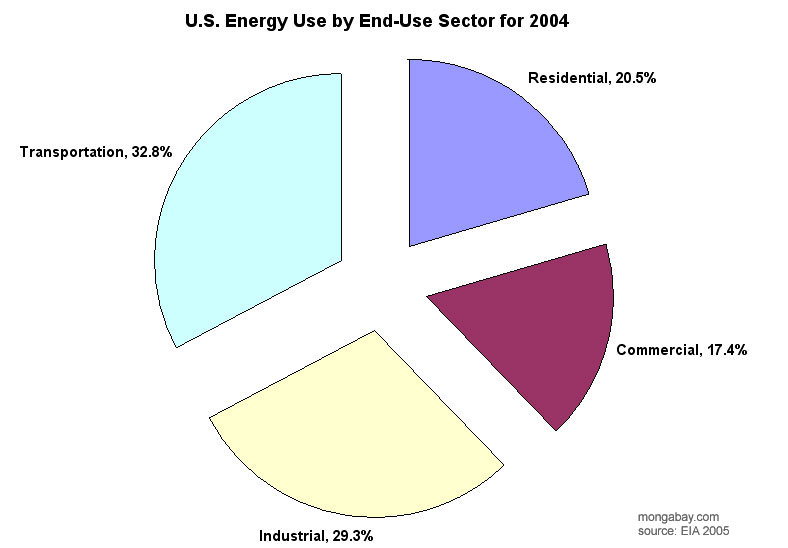
In the United States most energy use goes towards transportation according to the Energy Information Administration's Emissions of Greenhouse Gases in the United States 2004.
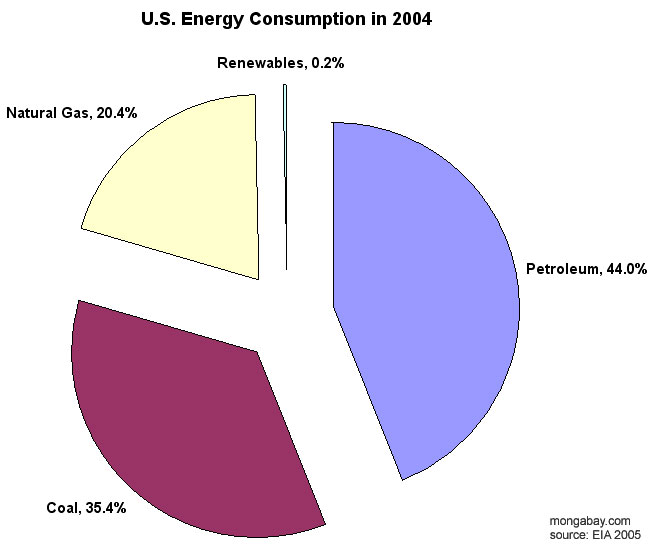
U.S. Energy Consumption, 2004
|
|
Renewable energy makes up less than one percent of energy consumption in the United States according to the Energy Information Administration's Emissions of Greenhouse Gases in the United States 2004.
Carbon Dioxide Emissions by Country, 1990-2025
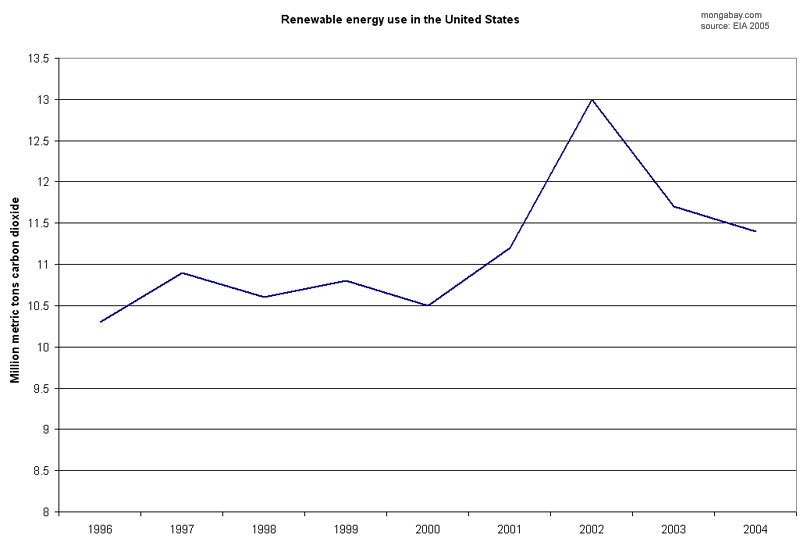
Despite high energy prices, the share of renewable energy used in the United States have fallen since peaking in 2002 according to the Energy Information Administration's Emissions of Greenhouse Gases in the United States 2004.
Global carbon dioxide concentrations with anthropogenic emissions, 1748-2002
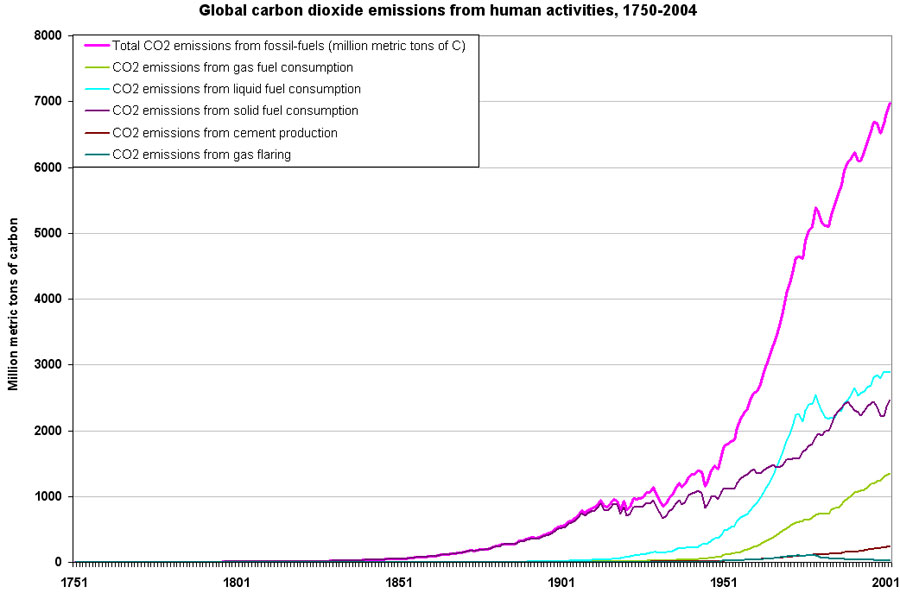
Atmospheric carbon dioxide concentrations have risen sharply since the Industrial Revolution. Source: Marland, G., T.A. Boden, and R. J. Andres. 2005. Global, Regional, and National CO2 Emissions. In Trends: A Compendium of Data on Global Change. Carbon Dioxide Information Analysis Center, Oak Ridge National Laboratory, U.S. Department of Energy, Oak Ridge, Tenn., U.S.A.
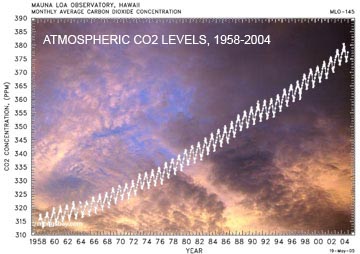
Atmospheric CO2 Record from Mauna Loa, 1958-2004
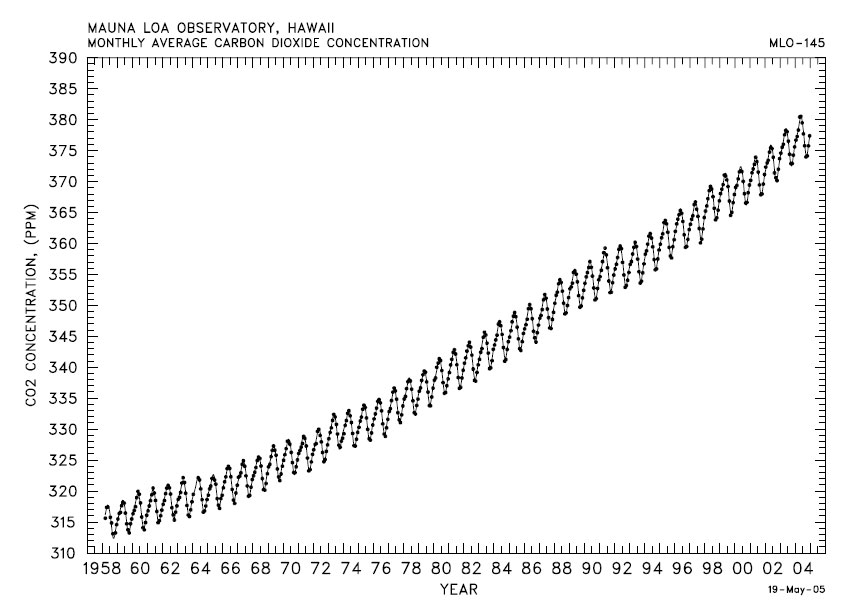
Atmospheric CO2 concentrations (ppmv), 1958-2004, derived from in situ air samples collected at Mauna Loa Observatory, Hawaii
Source: C.D. Keeling, T.P. Whorf, and the Carbon Dioxide Research Group at the Scripps Institution of Oceanography (SIO), University of California, La Jolla, California USA 92093-0444
Mean time to reach equilibrium for CO2 concentration, temperature, and sea level
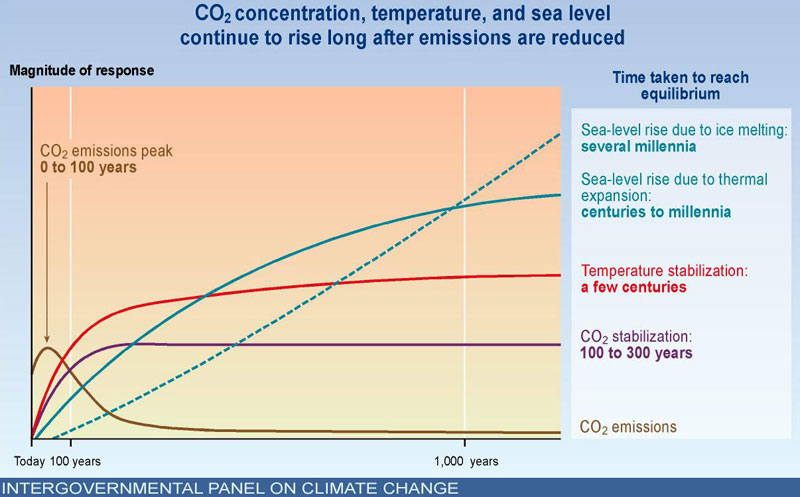
Intergovernmental Panel on Climate Change (IPCC) graph showing that CO2 concentration, temperature, and sea level continue to rise long after emissions are reduced. Image courtesy of the IPCC..
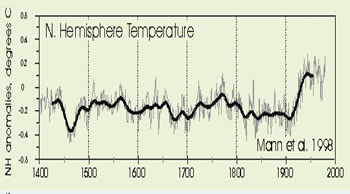
Variation of Earth's Surface Temperature, 1000-2000 and 1860-2000
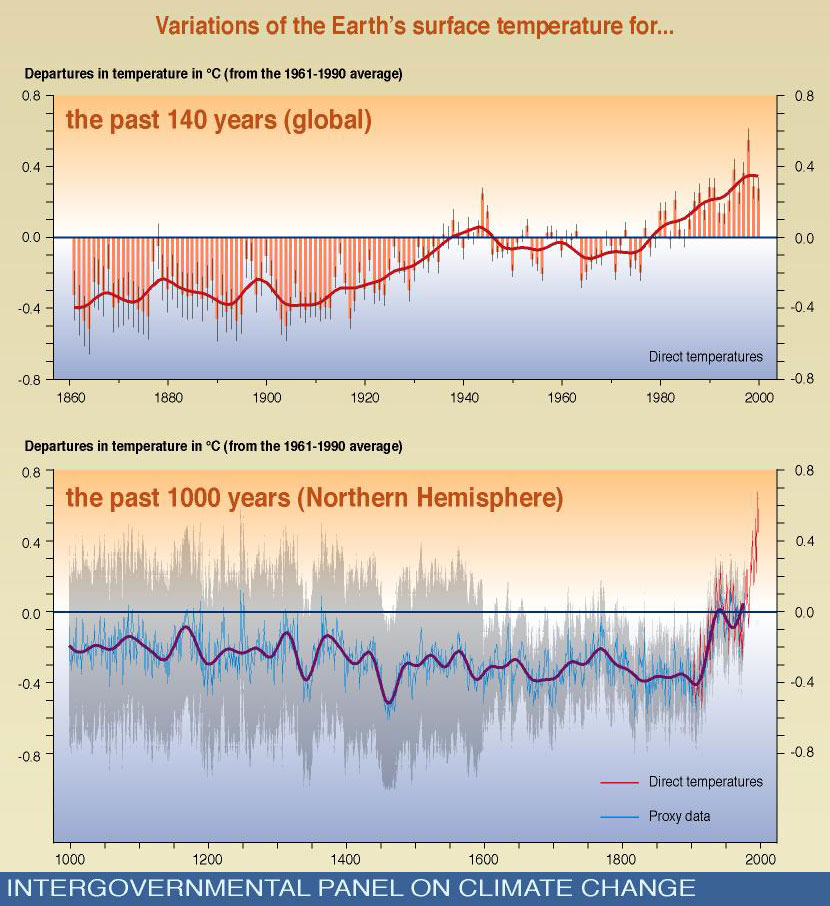
Intergovernmental Panel on Climate Change (IPCC) graph showing that surface temperatures for the past 140 years (global) and the past 1000 years (Northern Hemisphere).
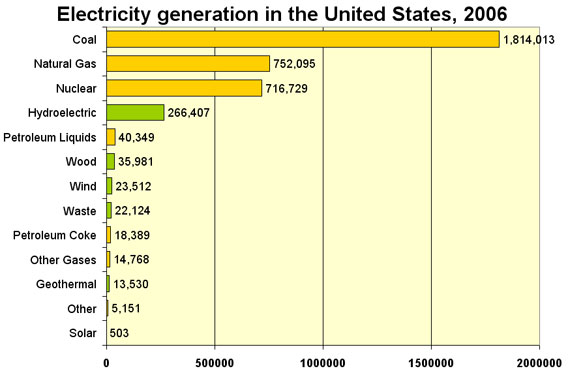
[ medium ] | Electricity generation in the United States, 2006 Showing coal, natural gas, nuclear, hydroelectric, petroelum liquids, wood, wind, waste, petroleum coke, geothermal, and solar. context of image |
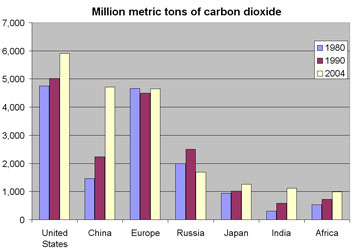
[ medium ] | CO2 emissions for highest emitting countries + Africa context of image |
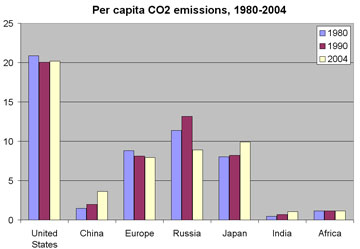
[ medium ] | Per capita CO2 emissions for highest emitting countries + Africa context of image |
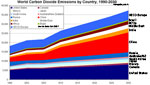 [ large medium small ] | Past and projected CO2 emissions for countries, 1990-2030 The Department of Energy's (DOE) Energy Information Administration's (EIA) forecasts for emissions from energy use until 2030 |
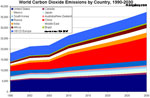 [ large medium small ] | Past and projected CO2 emissions for countries, 1990-2030 The Department of Energy's (DOE) Energy Information Administration's (EIA) forecasts for emissions from energy use until 2030 |
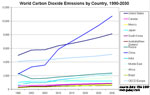 [ large medium small ] | Past and projected CO2 emissions for countries, 1990-2030 The Department of Energy's (DOE) Energy Information Administration's (EIA) forecasts for emissions from energy use until 2030 |
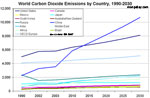 [ large medium small ] | Past and projected CO2 emissions for countries, 1990-2030 The Department of Energy's (DOE) Energy Information Administration's (EIA) forecasts for emissions from energy use until 2030 |
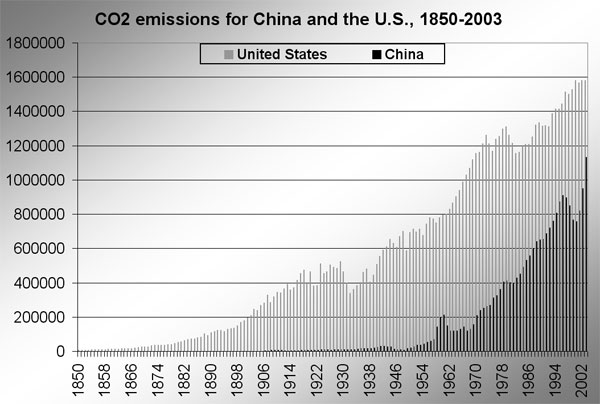
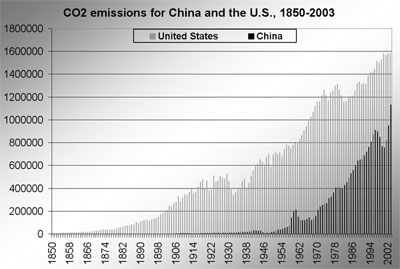
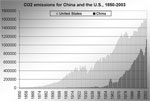 [ large medium small ] | CO2 emissions for China and the United States, 1850-2003 The race for the title of "Largest carbon dioxide emitter" pits the United States versus China. The United States had a large head start but China is expected to surpass it in emissions this year or next. context of image |
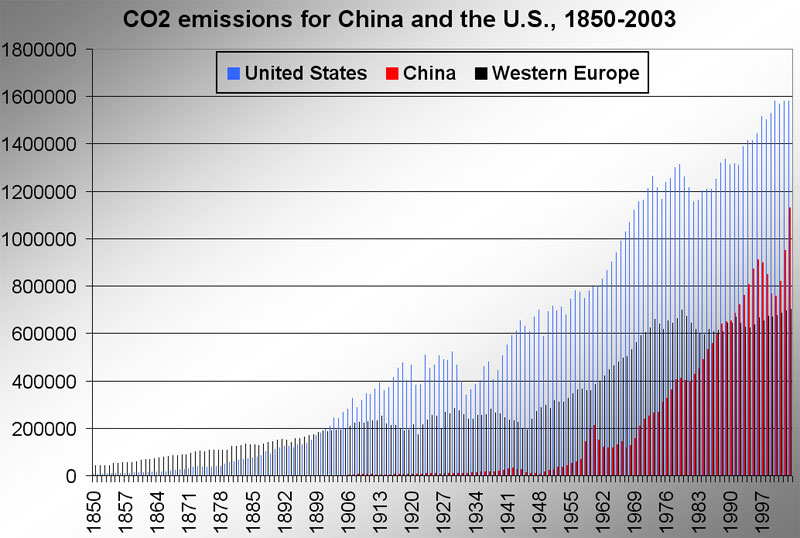
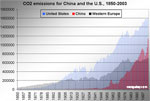 [ large medium small ] | Graph showing the growth of carbon dioxide emissions in China, the United States, and Western Europe from 1850-2003. context of image |
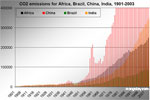
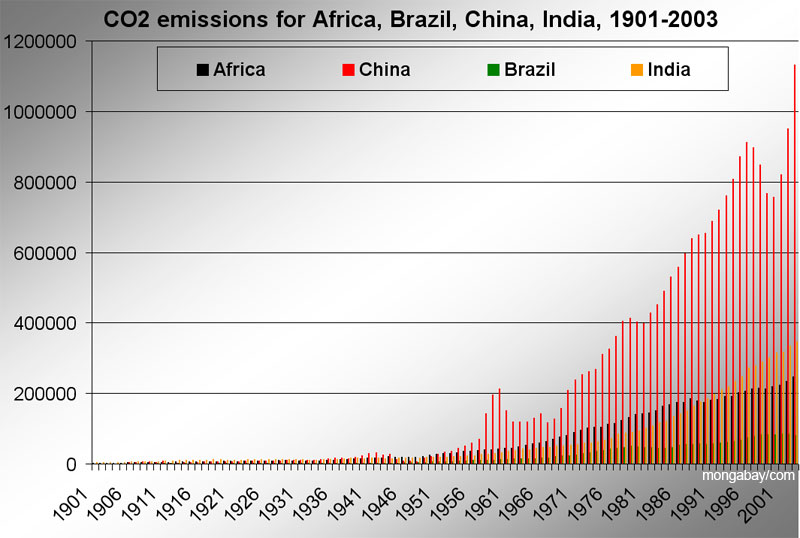
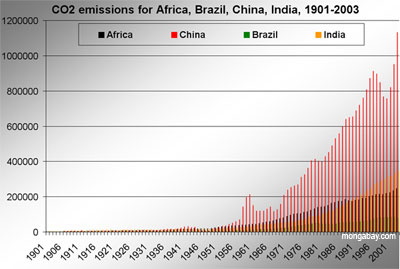
 [ large medium small ] | Graph showing the growth of carbon dioxide emissions in Africa, Brazil, China, and India from 1901-2003. context of image |
 [ large medium small ] | Graph showing the growth of carbon dioxide emissions in Africa, Brazil, China, and India from 1901-2003. context of image |
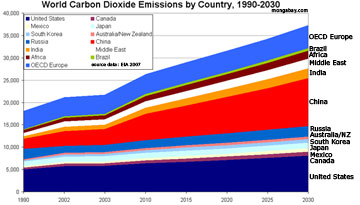
 [ large medium small ] | Graph showing the projected growth of carbon dioxide emissions by region from 1990-2030. |
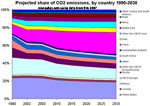 [ large medium small ] | Graph showing the projected share of carbon dioxide emissions by country from 1990-2030. |
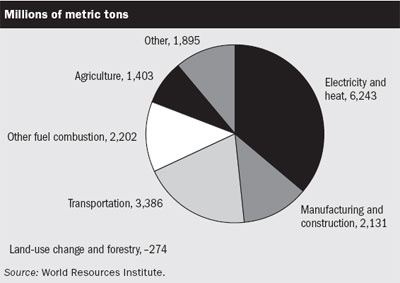
[ medium ] | Chart showing carbon dioxide emissions by source, 2000. Image courtesy of Little Green Data Book 2007 context of image |
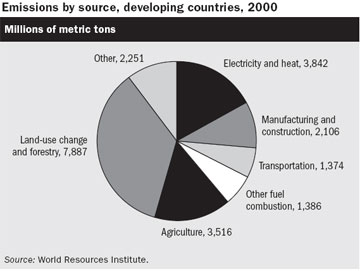
[ medium ] | Chart showing carbon dioxide emissions by source for developing countries, 2000. Image courtesy of Little Green Data Book 2007 context of image |
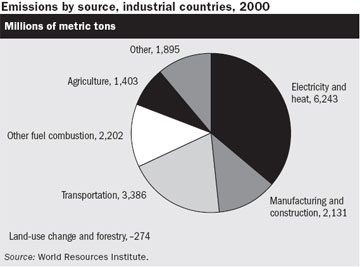
[ medium ] | Chart showing carbon dioxide emissions by source for industrial countries, 2000. Image courtesy of Little Green Data Book 2007 context of image |
[ medium ] | Chart showing share of carbon dioxide emissions, 2007. Image courtesy of Little Green Data Book 2007 context of image |
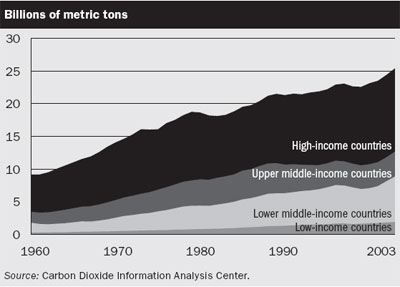
[ medium ] | Chart showing carbon dioxide emissions growth 1960-2003, 2007. Image courtesy of Little Green Data Book 2007 context of image |
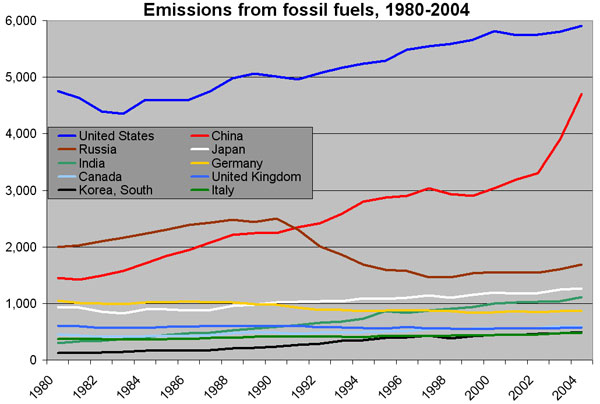
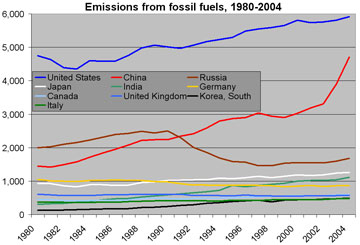
[ large medium ] | Chart showing carbon dioxide emissions from various countries, 1980-2005 context of image |
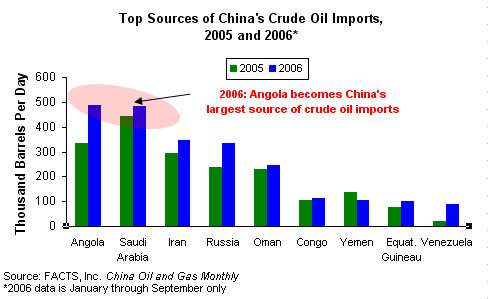
[ medium ] | Top sources of China's crude oil imports (from DOE EIA) |
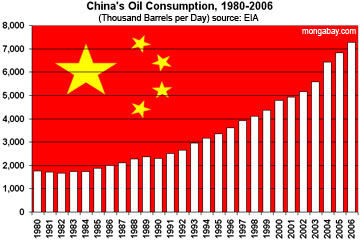
[ medium ] | China's oil consumption, 1980-2006 |
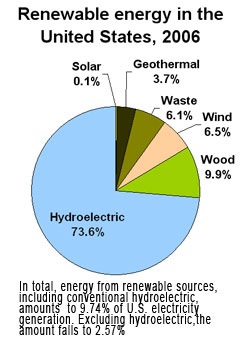
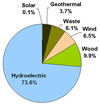 [ medium small ] | Renewable energy in the U.S. Chart showing renewable energy production in the United States for 2006. In total, energy from renewable sources, including conventional hydroelectric, amounts to 9.74% of U.S. electricity generation. Excluding hydroelectric, the amount falls to 2.57%. Figures from the Department of Energy's (DOE) Energy Information Administration (EIA). context of image |
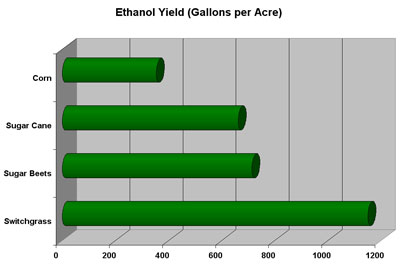
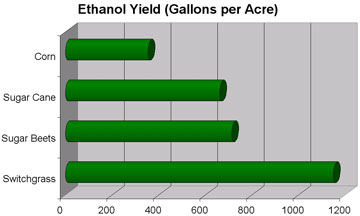
[ large medium ] | Ethanol yield (gallons per acre) for corn, sugar cane, suger beets, and swtichgrass context of image |
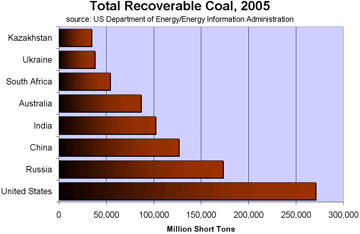
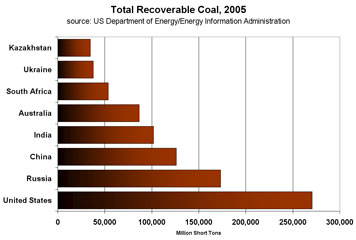
[ medium ] | Total recoverable coal by country, 2005 context of image |
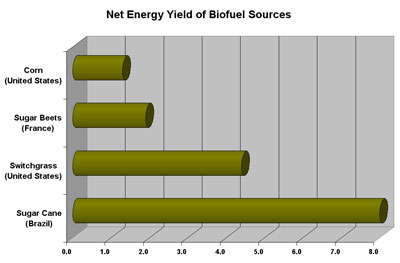
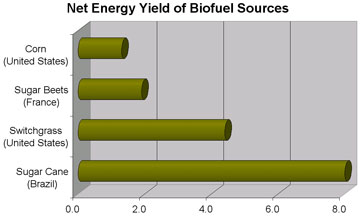
[ large medium ] | Net energy yield of corn, sugar beets, switchgrass, and sugar cane context of image |
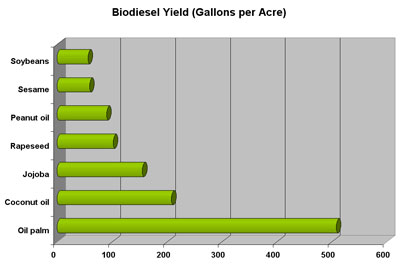
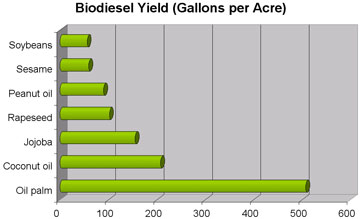
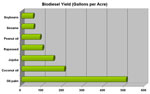 [ large medium small ] | Biodiesel yield (gallons per acre) for soybeans, sesame, peanut oil, rapseed, jojoba, coconut oil, and oil palm context of image |
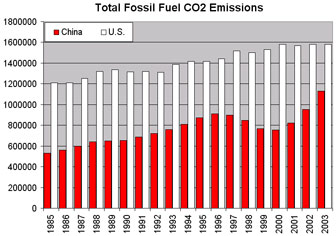
[ medium ] | Total CO2 emissions from fossil fuels for China and the United States, 1985-2003 context of image |
 [ medium small ] | Monthly average carbon dioixde concentration measured at the Mauna Loa Observatory in Hawaii 1958-2005 |
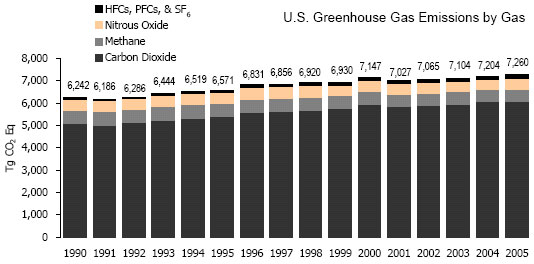
[ medium ] | U.S. Greenhouse gas emissions by gas, 1990-2005 |
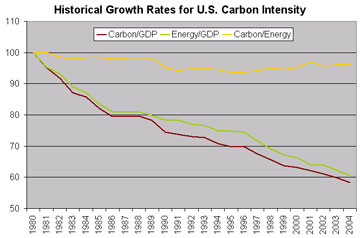
[ medium ] | Historic growth rates for U.S. carbon intensity |
[ medium ] | CO2 emissions by country, click to enlarge context of image |
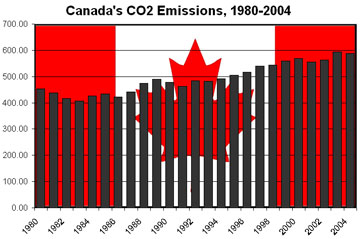
 [ medium small ] | Canada's CO2 emissions, 1980-2004 context of image |
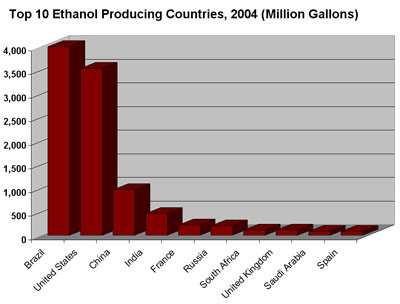
[ medium ] | Top 10 ethanol producing countries context of image |
[ medium ] | Total recoverable coal by country, 2005 context of image |
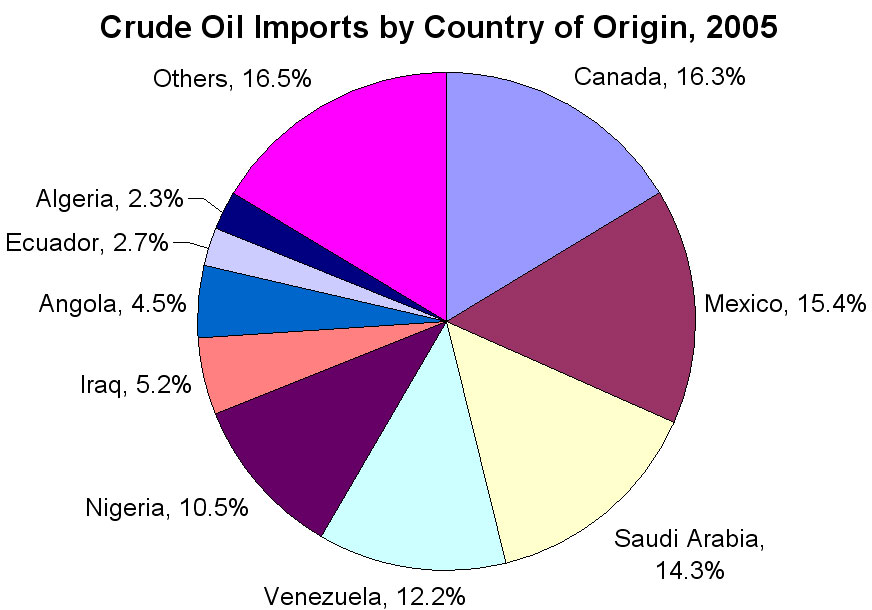
[ large medium ] | U.S. crude oil imports by country of origin, 2005 context of image |
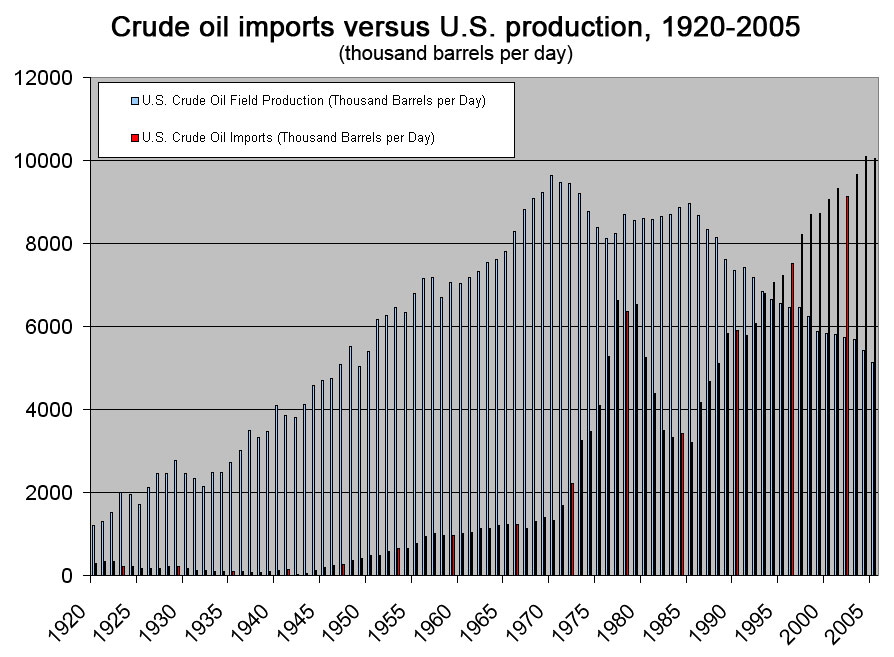
[ large medium ] | Crude oil imports versus U.S. production, 1920-2005 context of image |
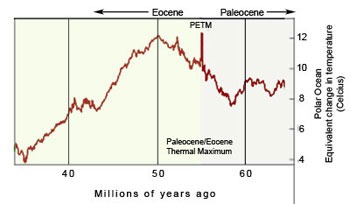
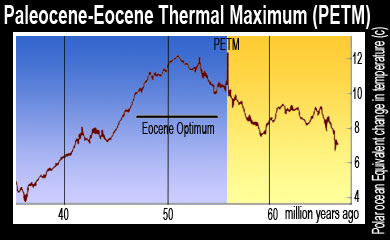
[ medium ] | Paleocene/Eocene thermal maximum context of image |
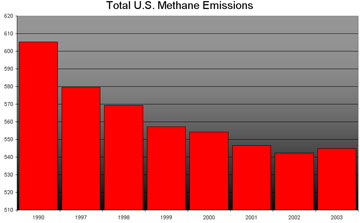
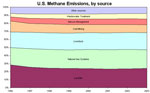 [ large medium small ] | Total U.S. methane emissions, 1990-2003 context of image |
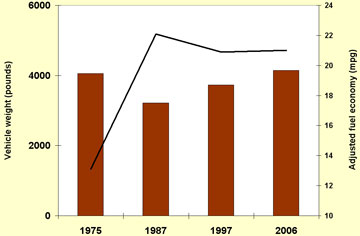
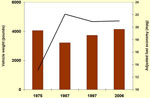 [ medium small ] | Fuel economy of the U.S. fleet, 1975-2006 context of image |
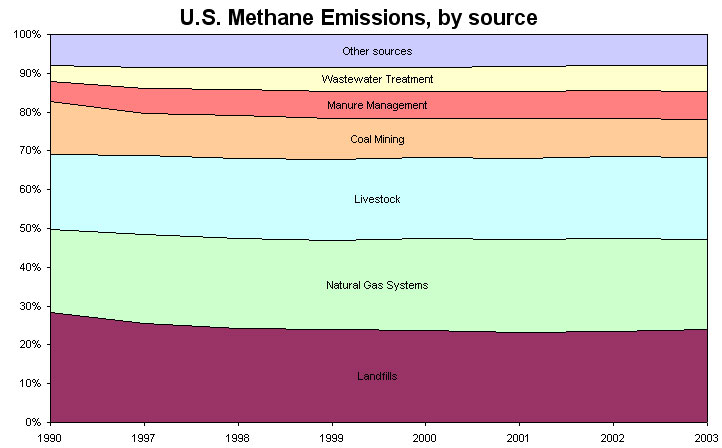
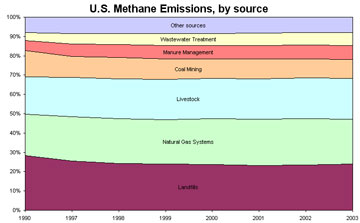
[ large medium ] | Methane emissions by source context of image |
[ medium ] | Hockeystick climate model context of image |
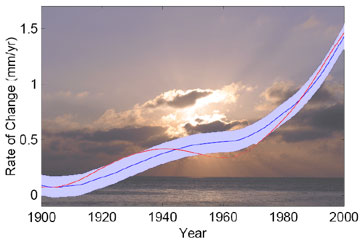
 [ medium small ] | Change in sea levels, 1900-2000 context of image |
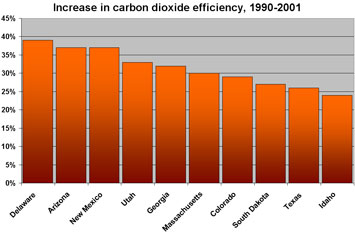
[ medium ] | Top states in terms of increase in carbon dioxide efficiency, 1990-2001 context of image |
[ medium ] | Change in global temperatures, 900-2000 context of image |
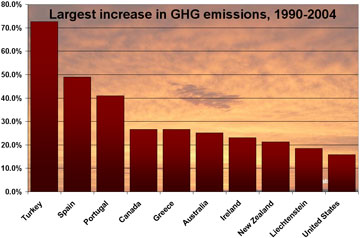
[ medium ] | Largest increase in GHG emissions in OECD states, 1990-2004 |
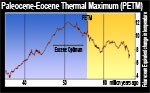 [ medium small ] | PETM context of image |
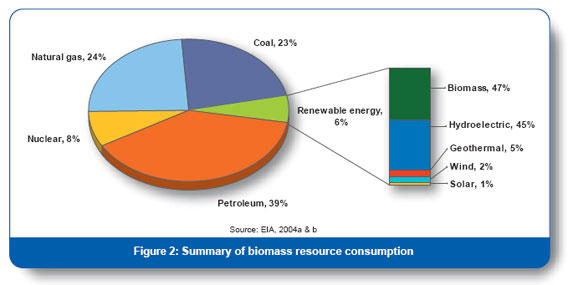
[ medium ] | Biomass resource consumption in the United States context of image |
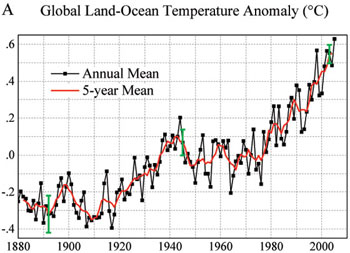
[ medium ] | Global land-ocean temperature anomaly, 1880-2000 |
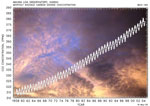 [ medium small ] | Monthly average carbon dioxide concentration measured at the Mauna Loa Observatory in Hawaii 1958-2005 |
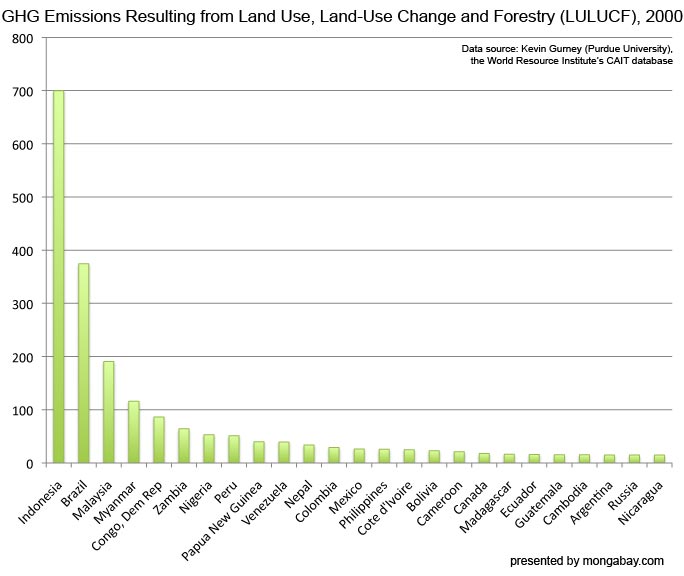
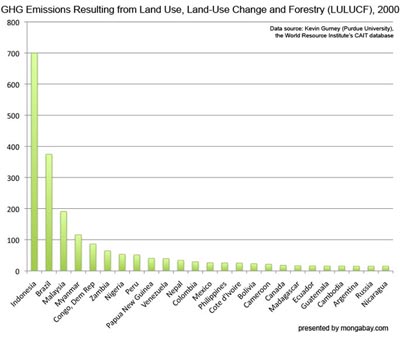
 [ large medium small ] | Greenhouse gas emissions resulting from Land Use, Land-Use Change and Forestry (LULUCF) LULUCF includes deforestation and forest degradation. The REDD mechanism seeks to reduce these emissions by compensating tropical countries for conserving their forests. context of image |
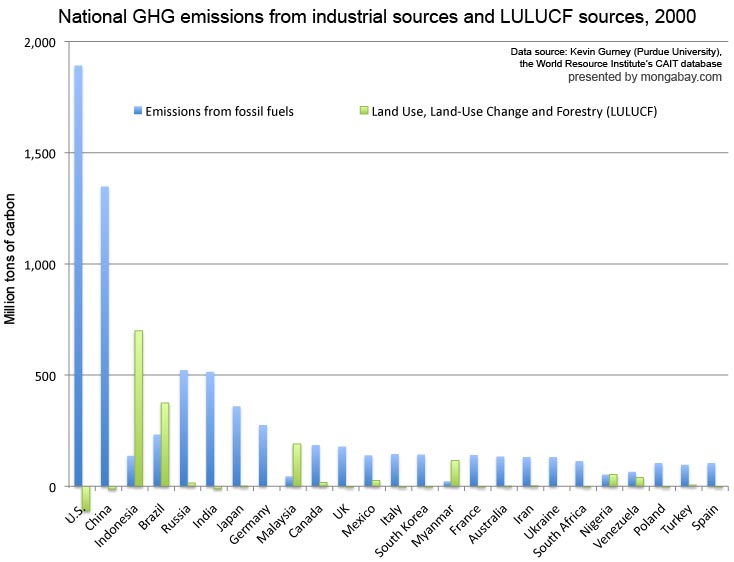
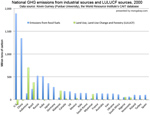
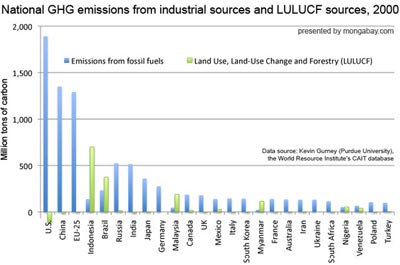
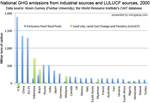
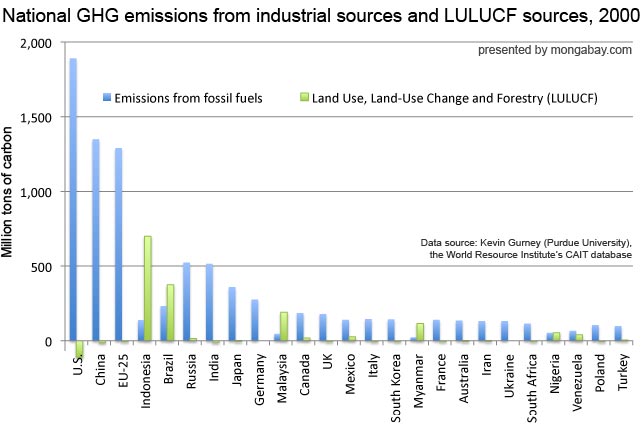 [ large medium small ] | National GHG emissions from industrial sources (electricity generation, transportation, buildings, etc) and LULUCF, 2000 Note that some countries have negative emissions from LULUCF meaning they these sources are a net carbon sink. Also note that the E.U. is listed in addition to its individual member countries. context of image |
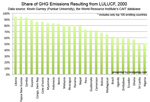
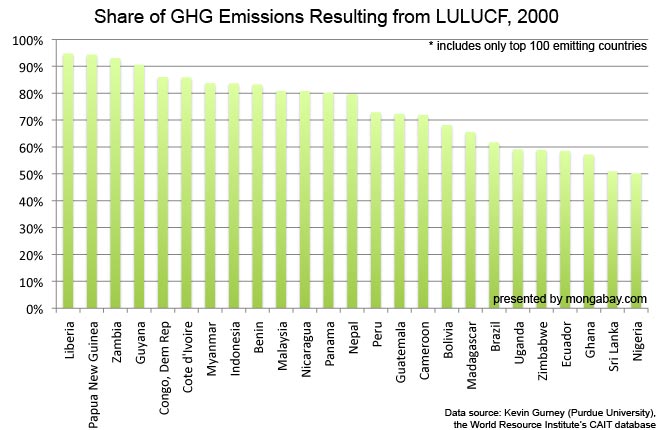 [ large medium small ] | Share of GHG emissions resulting from LULUCF in the year 2000 This chart includes on the 100 top emitting countries. context of image |
 [ large medium small ] | National GHG emissions from industrial sources (electricity generation, transportation, buildings, etc) and LULUCF, 2000 Note that some countries have negative emissions from LULUCF meaning they these sources are a net carbon sink. Also note that the E.U. is listed in addition to its individual member countries. context of image |
Deforestation charts and graphs
Country comparisons
National Fossil-Fuel CO2 Emissions from OAK RIDGE NATIONAL LABORATORY
Afghanistan
Albania
Algeria
Angola
Anguilla
Antarctic Fisheries
Antigua & Barbuda
Argentina
Armenia
Aruba
Australia
Austria
Azerbaijan
Bahamas
Bahrain
Bangladesh
Barbados
Belarus
Belgium & Luxembourg
Belgium
Belize
Benin
Bermuda
Bhutan
Bolivia
Bosnia & Herzegovina
Botswana
Brazil
British Virgin Islands
Brunei (Darussalam)
Bulgaria
Burkina Faso
Burundi
Cambodia
Canada
Cape Verde
Cat
Cayman Islands
Central African Republic
Chad
Chile
China (Mainland)
China Hong Kong Sar
China
Christmas Island
Colombia
Comoros
Congo
Cook Islands
Costa Rica
Cote D Ivoire
Croatia
Cuba
Cyprus
Czech Republic
Czechoslovakia
Democratic People S Republic of Korea
Democratic Republic of the Congo (Formerly Zaire)
Democratic Republic of Vietnam
Denmark
Djibouti
Dominica
Dominican Republic
East & West Pakistan
Ecuador
Egypt
El Salvador
Equatorial Guinea
Eritrea
Estonia
Ethiopia
Faeroe Islands
Falkland Islands (Malvinas)
Federal Republic of Germany
Federation of Malaya-Singapore
Fiji
Finland
Former Democratic Yemen
Former German Democratic Republic
Former Panama Canal Zone
Former Yemen
France (Including Monaco)
France
French Equatorial Africa
French Guiana
French Indo-China
French Polynesia
French West Africa
Gabon
Gambia
Georgia
Germany
Ghana
Gibraltar
Greece
Greenland
Grenada
Guadeloupe
Guatemala
Guinea Bissau
Guinea
Guyana
Haiti
Honduras
Hong Kong
Hungary
Iceland
India
Indonesia
Iran
Iraq
Ireland
Islamic Republic of Iran
Israel
Italy (Including San Marino)
Italy
Jamaica
Japan (Excluding the Ruyuku Islands)
Japan
Jordan
Kazakhstan
Kenya
Kiribati
Kuwait
Kuwaiti Oil Fires
Kyrgyzstan
Lao People S Democratic Republic
Latvia
Lebanon
Leeward Islands
Liberia
Libyan Arab Jamahiriyah
Lithuania
Luxembourg
Macau
Macedonia
Madagascar
Malawi
Malaysia
Maldives
Mali
Malta
Marshall Islands
Martinique
Mauritania
Mauritius
Mexico
Mongolia
Montserrat
Morocco
Mozambique
Myanmar
Namibia
Nauru
Nepal
Netherland Antilles and Aruba
Netherland Antilles
Netherlands
New Caledonia
New Zealand
Nicaragua
Niger
Nigeria
Niue
Norway
Occupied Palestinian Territory
Oman
Pacific Islands (Palau)
Pakistan
Palau
Panama
Papua New Guinea
Paraguay
Peninsular Malaysia
Peru
Philippines
Poland
Portugal
Puerto Rico
Qatar
Republic of Cameroon
Republic of Ireland
Republic of Korea
Republic of Moldova
Republic of South Vietnam
Reunion
Rhodesia-Nyasaland
Romania
Russian Federation
Rwanda-Urundi
Rwanda
Ryukyu Islands
Sabah
Saint Helena
Saint Lucia
Samoa
Sao Tome & Principe
Sarawak
Saudi Arabia
Senegal
Seychelles
Sierra Leone
Singapore
Slovakia
Slovenia
Solomon Islands
Somalia
South Africa
South Korea
Spain
Sri Lanka
St. Kitts-Nevis-Anguilla
St. Kitts-Nevis
St. Pierre & Miquelon
St. Vincent & the Grenadines
Sudan
Suriname
Swaziland
Sweden
Switzerland
Syrian Arab Republic
Taiwan
Tajikistan
Tanganyika
Thailand
Timor-Leste (Formerly East Timor)
Togo
Tonga
Trinidad and Tobago
Tunisia
Turkey
Turkmenistan
Uganda
Ukraine
United Arab Emirates
United Kingdom
United Korea
United Republic of Tanzania
United States of America
Uruguay
Ussr
Uzbekistan
Vanuatu
Venezuela
Viet Nam
Wallis and Futuna Islands
Western Sahara
Yemen
Yugoslavia (Former Socialist Federal Republic)
Yugoslavia
Zambia
Zanzibar
Zimbabwe
Continued: Local Impact of Deforestation