TROPICAL RAINFORESTS: Disappearing Opportunities
Carbon Dioxide Emissions Charts, 2005
|
|
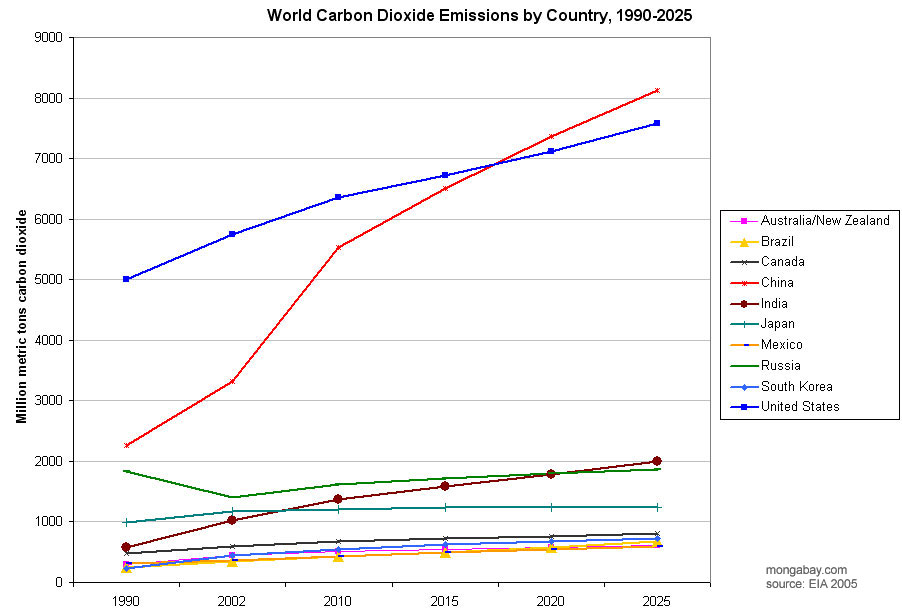
The Energy Information Administration expects China's carbon dioxide emissions to surpass those of the United States sometime around 2020. After China and the United States, among major polluters only India is expected to have significant growth of emissions over the next 20 years.
Carbon Dioxide Emissions by Market, 1990-2025
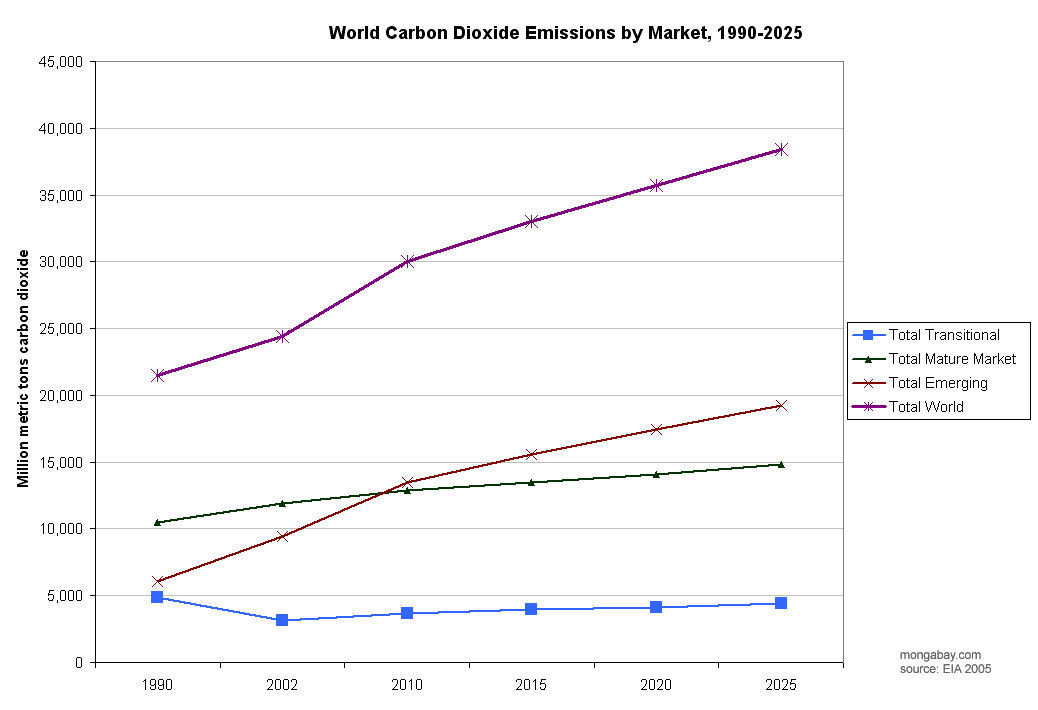
Emerging markets will have the largest growth in CO2 emissions over the next twenty years according to the Energy Information Administration's Emissions of Greenhouse Gases in the United States 2004.
Carbon Dioxide Emissions by Region, 1990-2025
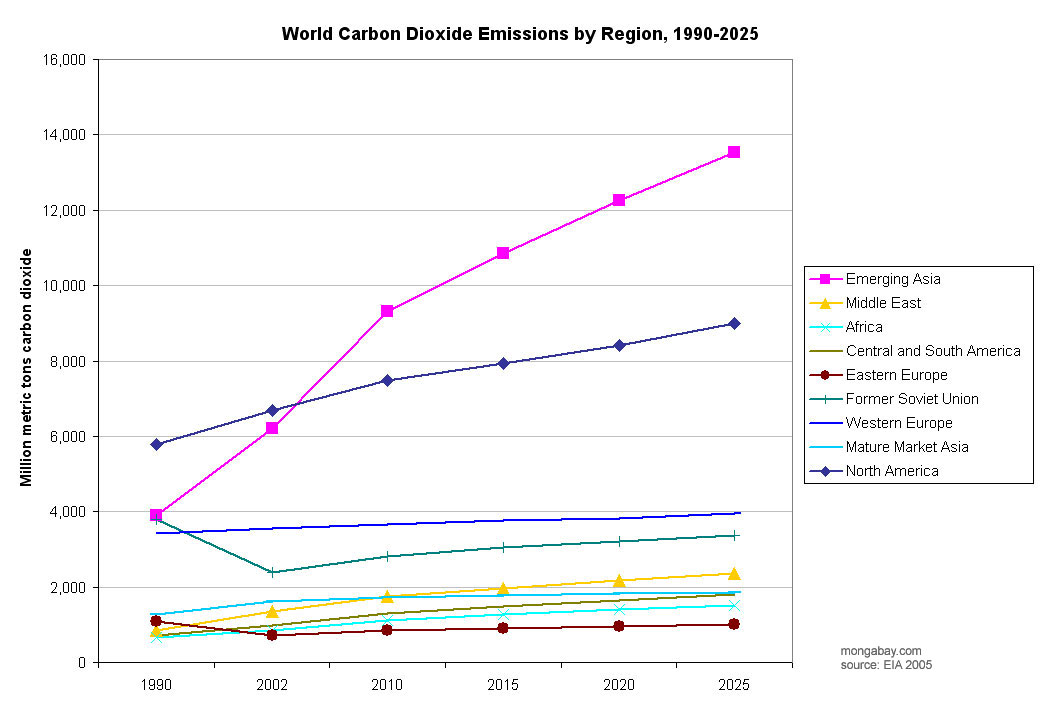
Led by China and India, carbon dioxide emissions are expected to surge in Asia over the next twenty years according to the Energy Information Administration's Emissions of Greenhouse Gases in the United States 2004. EIA projections show a leveling off of carbon dioxide emissions in other regions, except for North America where CO2 emissions will continue to increase at a steady rate.
U.S. Energy Use by End-Use Sector, 2004
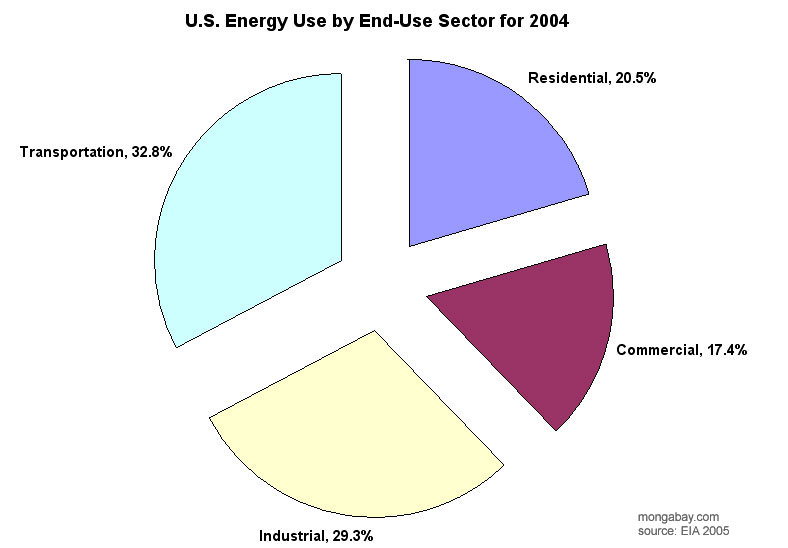
In the United States most energy use goes towards transportation according to the Energy Information Administration's Emissions of Greenhouse Gases in the United States 2004.
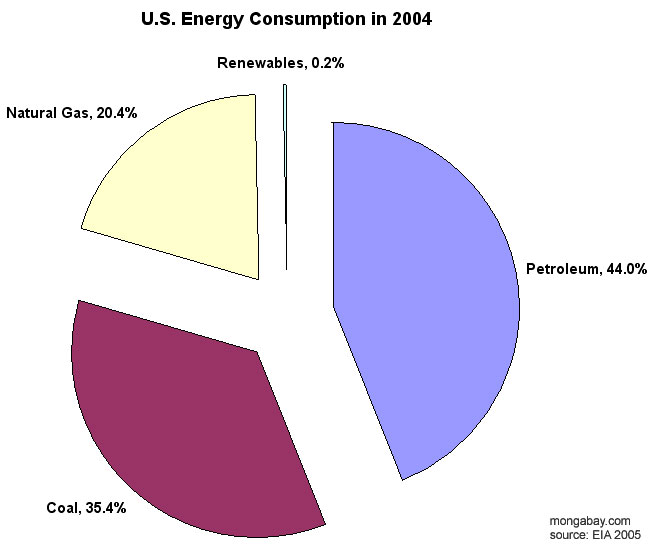
U.S. Energy Consumption, 2004
|
|
Renewable energy makes up less than one percent of energy consumption in the United States according to the Energy Information Administration's Emissions of Greenhouse Gases in the United States 2004.
Carbon Dioxide Emissions by Country, 1990-2025
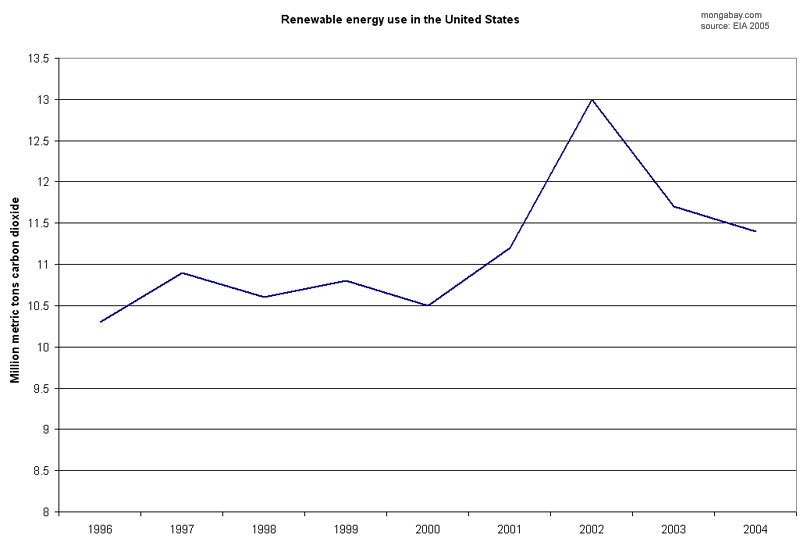
Despite high energy prices, the share of renewable energy used in the United States have fallen since peaking in 2002 according to the Energy Information Administration's Emissions of Greenhouse Gases in the United States 2004.
Global carbon dioxide concentrations with anthropogenic emissions, 1748-2002
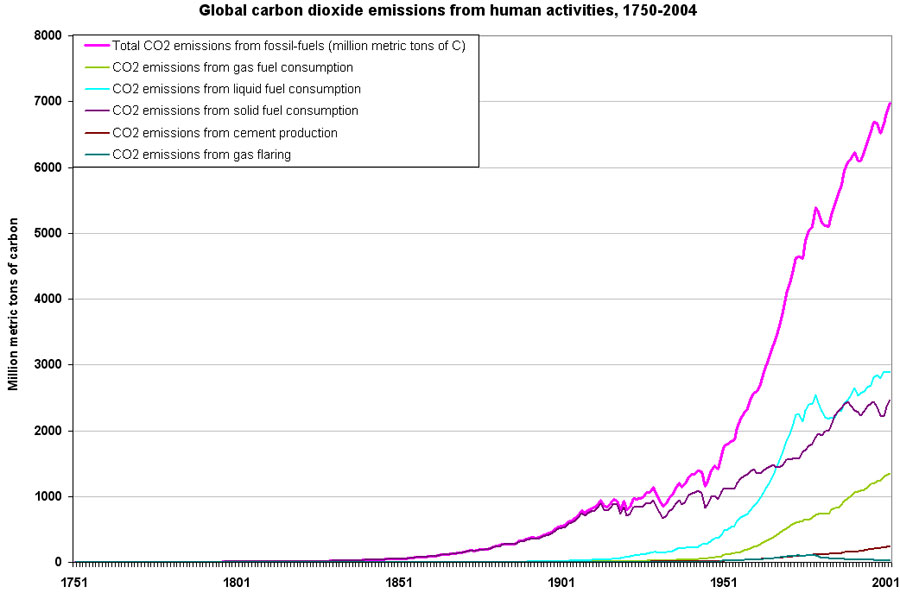
Atmospheric carbon dioxide concentrations have risen sharply since the Industrial Revolution. Source: Marland, G., T.A. Boden, and R. J. Andres. 2005. Global, Regional, and National CO2 Emissions. In Trends: A Compendium of Data on Global Change. Carbon Dioxide Information Analysis Center, Oak Ridge National Laboratory, U.S. Department of Energy, Oak Ridge, Tenn., U.S.A.
Atmospheric CO2 Record from Mauna Loa, 1958-2004
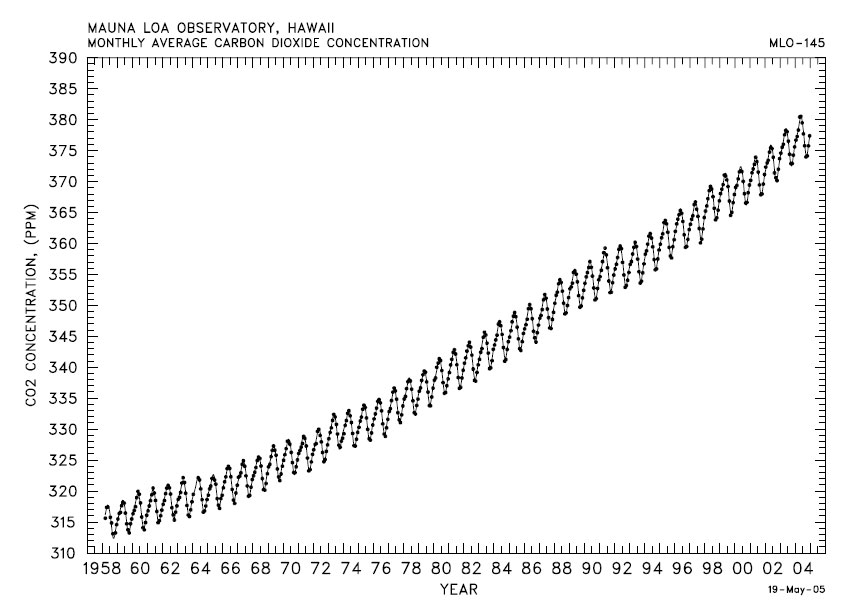
Atmospheric CO2 concentrations (ppmv), 1958-2004, derived from in situ air samples collected at Mauna Loa Observatory, Hawaii
Source: C.D. Keeling, T.P. Whorf, and the Carbon Dioxide Research Group at the Scripps Institution of Oceanography (SIO), University of California, La Jolla, California USA 92093-0444
Mean time to reach equilibrium for CO2 concentration, temperature, and sea level
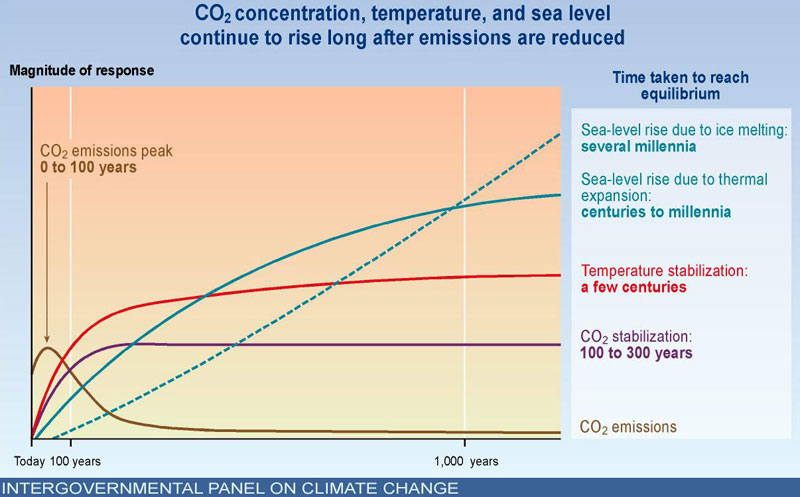
Intergovernmental Panel on Climate Change (IPCC) graph showing that CO2 concentration, temperature, and sea level continue to rise long after emissions are reduced. Image courtesy of the IPCC..
Variation of Earth's Surface Temperature, 1000-2000 and 1860-2000
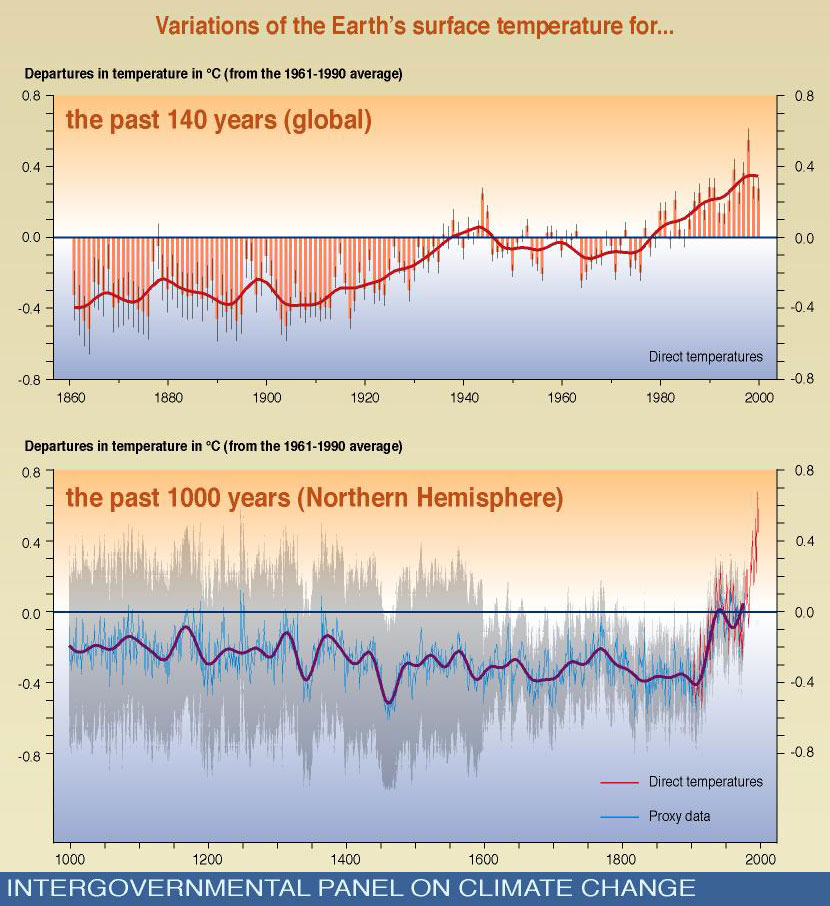
Intergovernmental Panel on Climate Change (IPCC) graph showing that surface temperatures for the past 140 years (global) and the past 1000 years (Northern Hemisphere).
Continued: Local Impact of Deforestation