
Rainforests country profiles

PHILIPPINES
|
|
Between 1990 and 2005 the Philippines lost a third of its forest cover, according to FAO estimates, but the country's deforestation is down since its peak in the 1980s and 1990s.
Widespread logging was responsible for much of the historical forest loss in the Philippines. Despite government bans on timber harvesting following severe flooding in the late 1980s and early 1990s, illegal logging continues today.
After temporarily lifting the log export ban in the late 1990s, the government has increasingly tried to crack down on timber smuggling and forest degradation. Additional threats to Philippine forests come from legal and illegal mining operations — which also cause pollution and have been linked to violent conflict — agricultural fires, collection of fuelwood, and rural population expansion. In recent years, deforestation has been increasingly blamed for soil erosion, river siltation, flooding, and drought; environmental awareness is now rising in the country.
Environmentalists in the Philippines now fear that plantation agriculture, especially oil palm, could emerge as the newest threat to remaining forests.
The continuing disappearance of Filipino wildlands is of great to concern to ecologists due to the high levels of endemic species. Of the 1,196 known species of amphibians, birds, mammals and reptiles in the country, nearly 46 percent are endemic. Among plants, the number is around 40 percent. Only about 5 percent of the Philippines land area is under some form of protection.
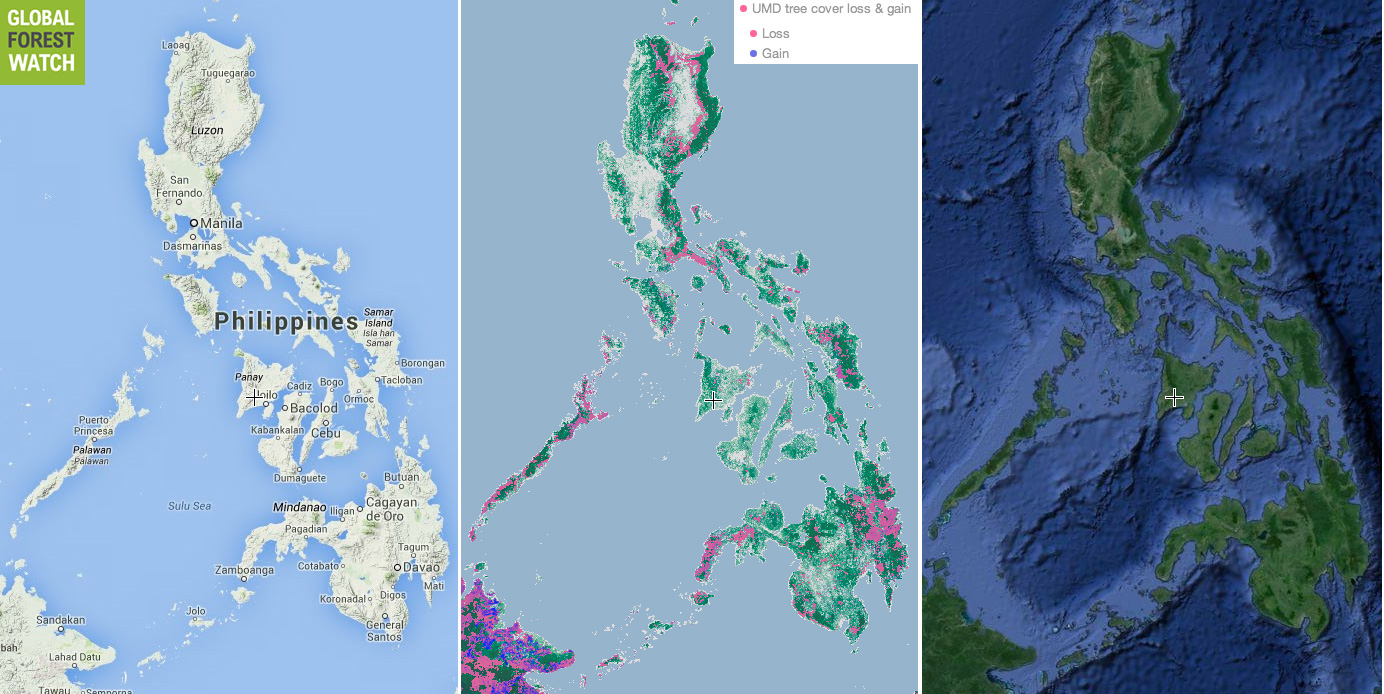
A closer look at the forests of the Philippines
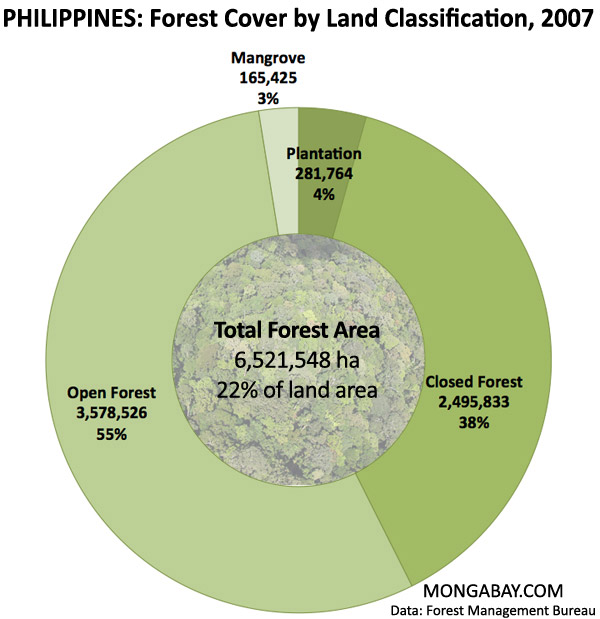
Estimates of current forest cover in the Philippines are highly variable between sources. According to the national Forest Management Bureau, forest cover in the Philippines declined from 21 million hectares, or 70% of the its land area, in 1900 to about 6.5 million hectares by 2007. This data is very similar that to the U.N. FAO, which is usually based on government data. Both the government and the FAO show an increase in overall forest cover since 1990.


Hansen et al 2013

Hansen et al 2013

Hansen et al 2013
| Total forest area | Dense forest area | Forest gain | Forest loss | Total land area | ||||||
| >10% tree cover (ha) | % total land cover | >50% tree cover (ha) | % total land cover | 2001-2012 (ha) | % total forest cover | 2001-2012 (ha) | % total forest cover | (ha) | ||
| Abra | 285086 | 71.8% | 244282 | 61.6% | 947 | 0.3% | 2504 | 0.9% | 396880 | |
| Agusan del Norte | 250875 | 86.1% | 226179 | 77.6% | 3903 | 1.6% | 7242 | 2.9% | 291360 | |
| Agusan del Sur | 790820 | 92.4% | 759500 | 88.7% | 17280 | 2.2% | 48442 | 6.1% | 856309 | |
| Aklan | 125945 | 76.5% | 107109 | 65.1% | 2040 | 1.6% | 2144 | 1.7% | 164547 | |
| Albay | 183242 | 73.3% | 157983 | 63.2% | 2493 | 1.4% | 6151 | 3.4% | 250040 | |
| Antique | 166118 | 60.9% | 137679 | 50.5% | 1217 | 0.7% | 2262 | 1.4% | 272634 | |
| Apayao | 356542 | 91.2% | 344467 | 88.1% | 4356 | 1.2% | 16446 | 4.6% | 391019 | |
| Aurora | 280263 | 92.4% | 271596 | 89.5% | 2378 | 0.8% | 7308 | 2.6% | 303394 | |
| Basilan | 126283 | 93.7% | 121967 | 90.5% | 1916 | 1.5% | 4605 | 3.6% | 134806 | |
| Bataan | 74613 | 57.3% | 66745 | 51.2% | 295 | 0.4% | 1310 | 1.8% | 130268 | |
| Batanes | 12781 | 63.9% | 10923 | 54.6% | 376 | 2.9% | 270 | 2.1% | 20000 | |
| Batangas | 160387 | 53.8% | 140235 | 47.0% | 2911 | 1.8% | 4627 | 2.9% | 298121 | |
| Benguet | 206975 | 78.6% | 177053 | 67.2% | 1154 | 0.6% | 2170 | 1.0% | 263379 | |
| Biliran | 45257 | 85.0% | 41932 | 78.7% | 450 | 1.0% | 487 | 1.1% | 53252 | |
| Bohol | 225612 | 57.0% | 177919 | 45.0% | 4290 | 1.9% | 3602 | 1.6% | 395747 | |
| Bukidnon | 544024 | 59.9% | 438034 | 48.2% | 5109 | 0.9% | 10732 | 2.0% | 908427 | |
| Bulacan | 133881 | 54.7% | 116659 | 47.7% | 1030 | 0.8% | 3517 | 2.6% | 244786 | |
| Cagayan | 549277 | 62.8% | 503373 | 57.5% | 5199 | 0.9% | 24911 | 4.5% | 875166 | |
| Camarines Norte | 177764 | 84.8% | 164580 | 78.5% | 1771 | 1.0% | 4367 | 2.5% | 209651 | |
| Camarines Sur | 370685 | 70.9% | 327625 | 62.6% | 4032 | 1.1% | 8352 | 2.3% | 523084 | |
| Camiguin | 21644 | 89.0% | 20061 | 82.5% | 259 | 1.2% | 149 | 0.7% | 24306 | |
| Capiz | 129218 | 49.4% | 93088 | 35.6% | 1996 | 1.5% | 2993 | 2.3% | 261350 | |
| Catanduanes | 133345 | 91.4% | 128941 | 88.4% | 1759 | 1.3% | 3153 | 2.4% | 145846 | |
| Cavite | 52313 | 42.2% | 44783 | 36.1% | 299 | 0.6% | 996 | 1.9% | 123930 | |
| Cebu | 253016 | 52.1% | 173531 | 35.7% | 2933 | 1.2% | 6749 | 2.7% | 485686 | |
| Compostela Valley | 375378 | 88.4% | 349621 | 82.4% | 8134 | 2.2% | 17403 | 4.6% | 424406 | |
| Davao del Norte | 267847 | 76.9% | 226594 | 65.1% | 4896 | 1.8% | 8264 | 3.1% | 348314 | |
| Davao del Sur | 423007 | 70.0% | 354343 | 58.7% | 7155 | 1.7% | 8882 | 2.1% | 604087 | |
| Davao Oriental | 465020 | 91.1% | 438976 | 86.0% | 8676 | 1.9% | 15162 | 3.3% | 510372 | |
| Dinagat Islands | 65322 | 82.1% | 56466 | 70.9% | 492 | 0.8% | 1370 | 2.1% | 79602 | |
| Eastern Samar | 405607 | 95.3% | 390730 | 91.8% | 3663 | 0.9% | 8195 | 2.0% | 425780 | |
| Guimaras | 26075 | 43.7% | 20627 | 34.5% | 436 | 1.7% | 525 | 2.0% | 59719 | |
| Ifugao | 152443 | 61.1% | 129064 | 51.7% | 1179 | 0.8% | 3475 | 2.3% | 249561 | |
| Ilocos Norte | 199064 | 59.0% | 168713 | 50.0% | 768 | 0.4% | 1573 | 0.8% | 337355 | |
| Ilocos Sur | 148490 | 59.4% | 124167 | 49.6% | 448 | 0.3% | 912 | 0.6% | 250099 | |
| Iloilo | 173644 | 37.1% | 132091 | 28.2% | 2865 | 1.6% | 5558 | 3.2% | 468481 | |
| Isabela | 541969 | 53.1% | 501274 | 49.1% | 2897 | 0.5% | 20806 | 3.8% | 1020881 | |
| Kalinga | 208399 | 72.0% | 188900 | 65.2% | 1452 | 0.7% | 4399 | 2.1% | 289554 | |
| La Union | 83700 | 57.5% | 67594 | 46.4% | 241 | 0.3% | 596 | 0.7% | 145634 | |
| Laguna | 123530 | 67.5% | 114030 | 62.3% | 1171 | 0.9% | 5479 | 4.4% | 183113 | |
| Lanao del Norte | 225190 | 79.5% | 199083 | 70.3% | 1176 | 0.5% | 3943 | 1.8% | 283331 | |
| Lanao del Sur | 294877 | 83.9% | 271254 | 77.2% | 964 | 0.3% | 6949 | 2.4% | 351576 | |
| Leyte | 427230 | 77.0% | 387171 | 69.8% | 4748 | 1.1% | 8132 | 1.9% | 554774 | |
| Maguindanao | 100281 | 40.8% | 63298 | 25.7% | 1297 | 1.3% | 3553 | 3.5% | 245889 | |
| Marinduque | 75236 | 81.5% | 69952 | 75.8% | 1411 | 1.9% | 1677 | 2.2% | 92288 | |
| Masbate | 172665 | 43.3% | 135620 | 34.0% | 2936 | 1.7% | 4754 | 2.8% | 398656 | |
| Metropolitan Manila | 5878 | 10.8% | 2347 | 4.3% | 32 | 0.5% | 66 | 1.1% | 54454 | |
| Misamis Occidental | 149098 | 78.8% | 126568 | 66.9% | 2364 | 1.6% | 2814 | 1.9% | 189232 | |
| Misamis Oriental | 228189 | 68.6% | 188948 | 56.8% | 2272 | 1.0% | 2879 | 1.3% | 332435 | |
| Mountain Province | 166950 | 78.5% | 149425 | 70.2% | 860 | 0.5% | 3752 | 2.2% | 212810 | |
| Negros Occidental | 257313 | 33.0% | 185838 | 23.9% | 2460 | 1.0% | 4391 | 1.7% | 778940 | |
| Negros Oriental | 224358 | 44.9% | 168820 | 33.8% | 2819 | 1.3% | 5555 | 2.5% | 499182 | |
| North Cotabato | 319885 | 50.4% | 245273 | 38.6% | 3893 | 1.2% | 9462 | 3.0% | 634974 | |
| Northern Samar | 306250 | 90.7% | 292055 | 86.5% | 3788 | 1.2% | 7021 | 2.3% | 337578 | |
| Nueva Ecija | 174914 | 32.2% | 143157 | 26.3% | 1667 | 1.0% | 3631 | 2.1% | 543761 | |
| Nueva Vizcaya | 276650 | 70.5% | 235898 | 60.1% | 2823 | 1.0% | 7567 | 2.7% | 392241 | |
| Occidental Mindoro | 359721 | 61.0% | 316382 | 53.6% | 5994 | 1.7% | 8208 | 2.3% | 589963 | |
| Oriental Mindoro | 305625 | 73.7% | 270715 | 65.3% | 7018 | 2.3% | 9263 | 3.0% | 414606 | |
| Palawan | 1224507 | 85.0% | 1148213 | 79.7% | 28012 | 2.3% | 64347 | 5.3% | 1441271 | |
| Pampanga | 45454 | 21.0% | 28208 | 13.0% | 446 | 1.0% | 1090 | 2.4% | 216395 | |
| Pangasinan | 166160 | 32.2% | 110701 | 21.5% | 659 | 0.4% | 1981 | 1.2% | 515664 | |
| Quezon | 719241 | 86.3% | 680114 | 81.6% | 11690 | 1.6% | 30708 | 4.3% | 833110 | |
| Quirino | 242182 | 78.3% | 223977 | 72.4% | 1523 | 0.6% | 9844 | 4.1% | 309245 | |
| Rizal | 80900 | 64.0% | 70429 | 55.7% | 1170 | 1.4% | 2149 | 2.7% | 126432 | |
| Romblon | 105335 | 79.8% | 96132 | 72.9% | 1213 | 1.2% | 3181 | 3.0% | 131943 | |
| Samar | 486864 | 89.8% | 447249 | 82.5% | 9346 | 1.9% | 16047 | 3.3% | 542184 | |
| Sarangani | 232465 | 71.7% | 191349 | 59.1% | 2867 | 1.2% | 7039 | 3.0% | 324006 | |
| Shariff Kabunsuan | 142126 | 62.2% | 107264 | 47.0% | 1097 | 0.8% | 3942 | 2.8% | 228381 | |
| Siquijor | 16532 | 51.6% | 11431 | 35.7% | 489 | 3.0% | 143 | 0.9% | 32008 | |
| Sorsogon | 160994 | 81.3% | 147943 | 74.7% | 1281 | 0.8% | 2388 | 1.5% | 197925 | |
| South Cotabato | 249488 | 57.5% | 203114 | 46.8% | 4183 | 1.7% | 7103 | 2.8% | 433999 | |
| Southern Leyte | 150785 | 89.7% | 142566 | 84.8% | 1246 | 0.8% | 3007 | 2.0% | 168034 | |
| Sultan Kudarat | 274039 | 62.0% | 234263 | 53.0% | 4070 | 1.5% | 10293 | 3.8% | 441872 | |
| Sulu | 131730 | 90.3% | 122419 | 84.0% | 2371 | 1.8% | 2925 | 2.2% | 145812 | |
| Surigao del Norte | 167643 | 84.2% | 151673 | 76.2% | 1031 | 0.6% | 2155 | 1.3% | 199027 | |
| Surigao del Sur | 396702 | 92.6% | 380925 | 88.9% | 7465 | 1.9% | 18139 | 4.6% | 428458 | |
| Tarlac | 87583 | 29.1% | 71543 | 23.7% | 1287 | 1.5% | 1766 | 2.0% | 301321 | |
| Tawi-Tawi | 104289 | 94.7% | 100697 | 91.5% | 2098 | 2.0% | 5895 | 5.7% | 110087 | |
| Zambales | 197234 | 54.2% | 159316 | 43.8% | 681 | 0.3% | 3406 | 1.7% | 363598 | |
| Zamboanga del Norte | 484838 | 76.0% | 419478 | 65.8% | 13187 | 2.7% | 26041 | 5.4% | 637981 | |
| Zamboanga del Sur | 344226 | 65.5% | 281327 | 53.5% | 7678 | 2.2% | 11572 | 3.4% | 525809 | |
| Zamboanga Sibugay | 202193 | 75.0% | 174361 | 64.7% | 4161 | 2.1% | 10044 | 5.0% | 269565 | |
| Philippines | 19799282 | 67.7% | 17415929 | 59.5% | 272638 | 1.4% | 616910 | 3.1% | 29251764 | |
Philippines environmental news updates | XML
| Philippines Forest Figures
Forest Cover Total forest area: 7,162,000 ha % of land area: 24% Primary forest cover: 829,000 ha % of land area: 2.8% % total forest area: 11.6% Deforestation Rates, 2000-2005 Annual change in forest cover: -157,400 ha Annual deforestation rate: -2.1% Change in defor. rate since '90s: -20.2% Total forest loss since 1990: -3,412,000 ha Total forest loss since 1990:-32.3% Primary or "Old-growth" forests Annual loss of primary forests: n/a Annual deforestation rate: n/a Change in deforestation rate since '90s: n/a Primary forest loss since 1990: n/a Primary forest loss since 1990:0.0% Forest Classification Public: 89.5% Private: 10.5% Other: n/a Use Production: 75% Protection: 11% Conservation: 12% Social services: n/a Multiple purpose: n/a None or unknown: 2 Forest Area Breakdown Total area: 7,162,000 ha Primary: 829,000 ha Modified natural: 5,713,000 ha Semi-natural: n/a Production plantation: 304,000 ha Production plantation: 316,000 ha Plantations Plantations, 2005: 620,000 ha % of total forest cover: 8.7% Annual change rate (00-05): -46,400,000 ha Carbon storage Above-ground biomass: 1,566 M t Below-ground biomass: 376 M t Area annually affected by Fire: 6,000 ha Insects: n/a Diseases: 1,000 ha Number of tree species in IUCN red list Number of native tree species: 3,000 Critically endangered: 46 Endangered: 35 Vulnerable: 134 Wood removal 2005 Industrial roundwood: 403,000 m3 o.b. Wood fuel: 138,000 m3 o.b. Value of forest products, 2005 Industrial roundwood: $60,272,000 Wood fuel: $722,000 Non-wood forest products (NWFPs): n/a Total Value: $60,994,000 More forest statistics for Philippines |
- The Rough Guide to The Philippines
- Philippines Travel Guide
- A Guide to the Birds of the Philippines
- Birds of the Philippines
- Plundering Paradise: The Struggle for the Environment in the Philippines
- Palawan at the Crossroads: Development and the Environment on a Philippine Frontier
FAO-Forestry Profile