|
|
Charts and graphs about the Amazon rainforest
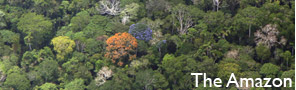
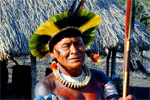
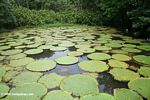
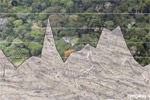
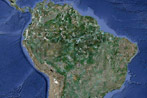
The Amazon

RAISG's map of the Amazon.

Protected areas and indigenous territories in the Amazon.
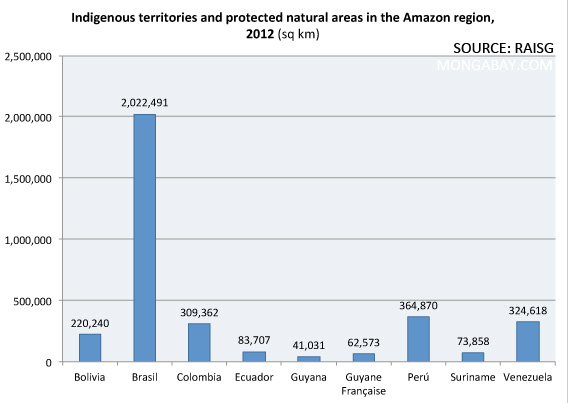
Extent of protected natural areas and indigenous territories in the Amazon
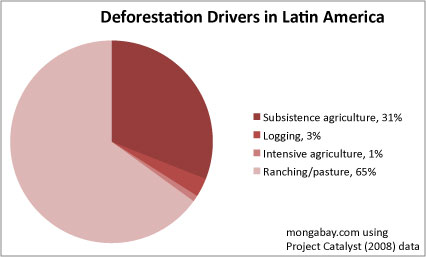
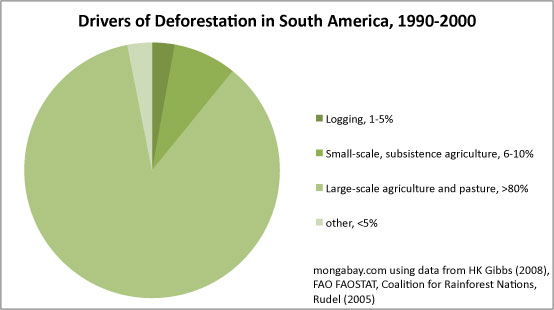
Drivers of deforestation in Latin America
Click to enlarge
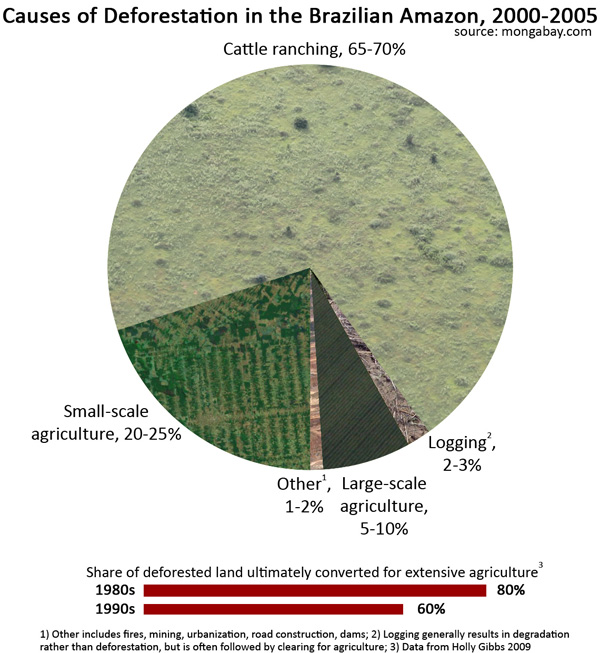
The above pie chart showing deforestation in the Amazon by cause is based on the median figures for estimate ranges.
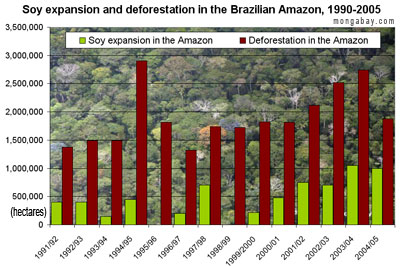
Annual deforestation rates and annual soy expansion for states in the Brazilian Amazon 1990-2005. Note that the 1995-1996 and 1998-1999 years were negative and do not show up on the chart. Graphs based on Brazilian government data.
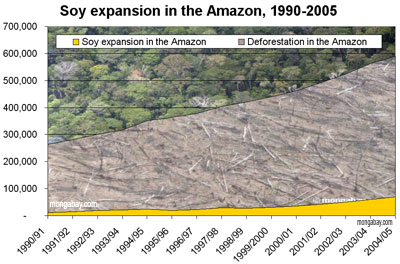
Total deforestation and area of soybean cultivation across states in the Brazilian Amazon. Overall soybean cultivation makes up only a small portion of deforestation. Further, soybean expansion and the associated infrastructure development and farmer displacement is driving deforestation by other actors. Note: some soybean farms are established on already degraded rainforest lands and neighboring cerrado ecosystems. Therefore it would be inappropriate to assume the area of soybean planting represents its actual role in deforestation.
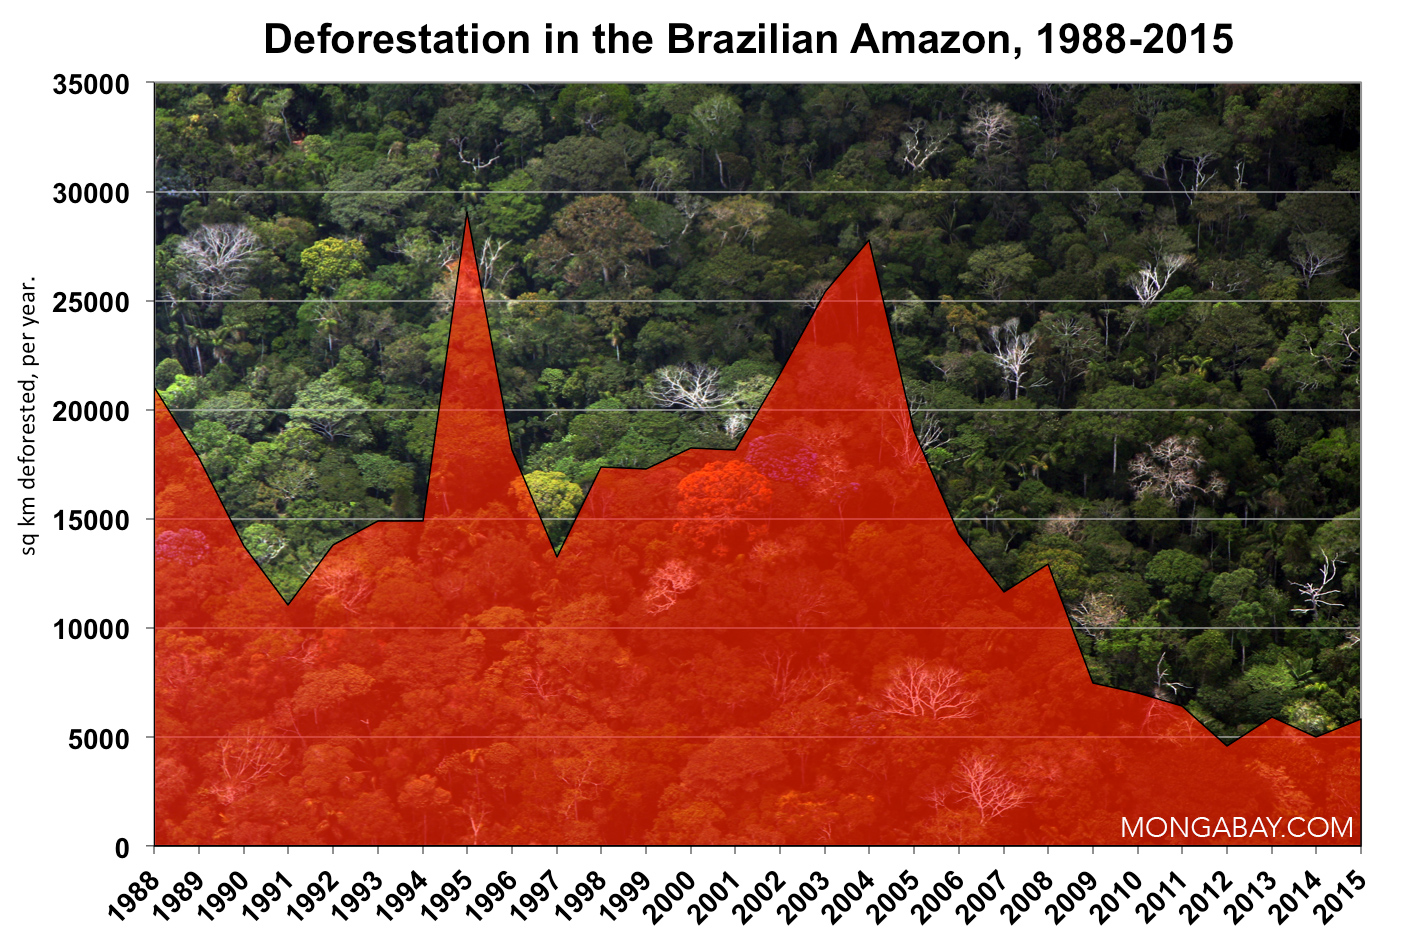
Deforestation rates

Annual deforestation in the Brazilian Amazon
 South America: change in moist forest cover, 2001-2010 (square kilometers)
Bolivia
Drivers of deforestation in Bolivia
Carbon

Decline in emissions from deforestation.
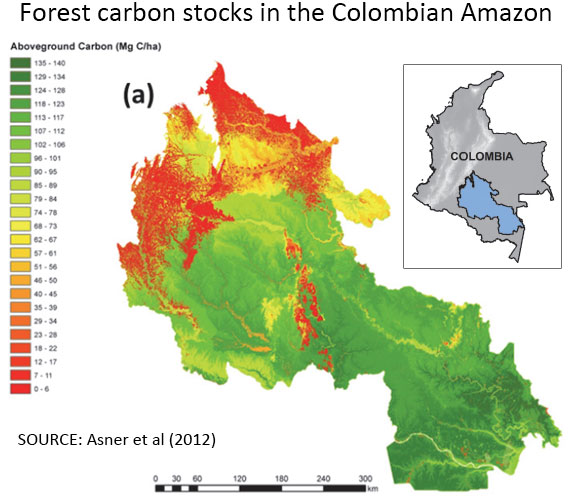 Forest carbon map of the study area in Colombia. Courtesy of Asner et al 2012 Forest carbon map of the study area in Colombia. Courtesy of Asner et al 2012
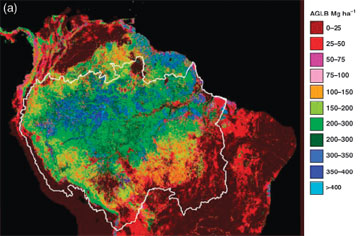
Aboveground live biomass (AGLB) class map of terra firme old growth forests derived from the decision rule classifier and multiple layers of remote sensing data.
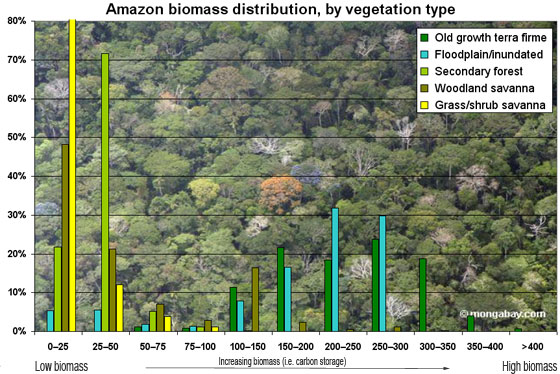
The biomass range (metric tons per hectare) for general vegetation types in the Amazon Basin. The authors report the following distribution of vegetation category for the basin: Old growth terra firme forest (62.3% of the legal Amazon [(8 235 430 sq km]); Floodplain and inundated forest (4.19%); Secondary forest (1.67%); Woodland savanna (24.47%); and Grass/shrub savanna (4.79%). The authors report average biomass ranges as follows: Dense forest 272.5 Mt/ha, Open forest 200.2 Mt/ha, Bamboo forest 212.3 Mt/ha, Liana/dry forest 189.7 Mt/ha, Seasonal/deciduous forest 225.6 Mt/ha, and Varzea flooded forest 248.3 Mt/ha. Image produced by Rhett A. Butler using data from the authors.
Aboveground live biomass classification and the spatial accuracy assessment: (a) biomass map of the Amazon basin at 1 km spatial resolution derived from combined decision tree method and regression analysis with 11 biomass classes and overall accuracy of 88%.
Other topics
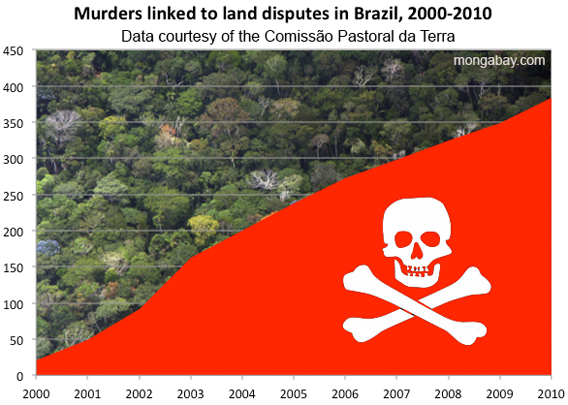
Murders tied to land disputes in rural Brazil, cumulative total of 383 since 2000.
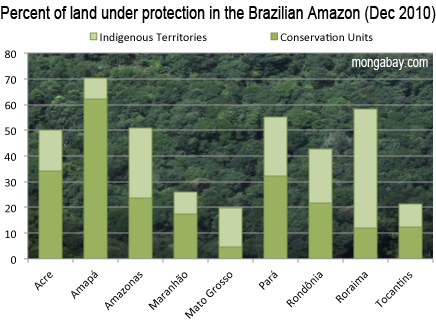
Percent of land under protection in the Brazilian Amazon as of December 2010.
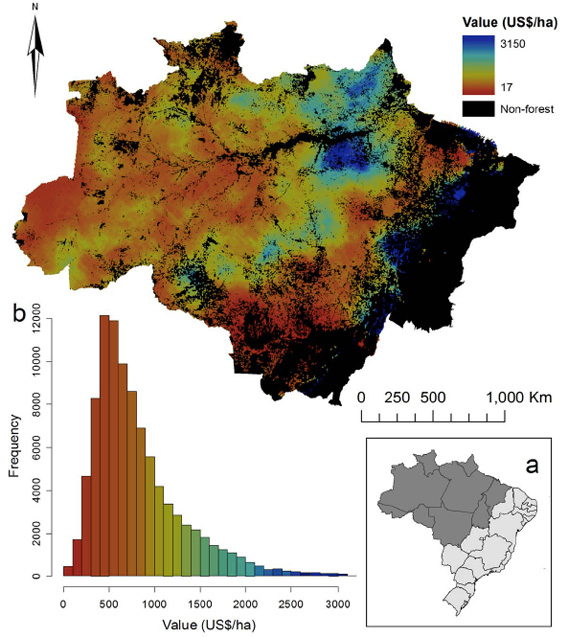
Map of timber value in the Amazon. Values range from low (US$17 per ha) to high (US$3150 per ha). Insets: (a) dark shading shows the spatial extent of the Brazilian Amazon within Brazil, including the state boundaries; (b) frequency distribution of timber values (US$/ha) in the Brazilian Amazon, calculated over 151,073,784 equal-area grid squares of area 0.25 sq km. Image and caption courtesy of the authors.
THE AMAZON RAINFOREST
|
|
For kids
Multi-media
|
|
|
|
|
THE AMAZON
ADVERTISEMENT
KEY ARTICLES
RAINFORESTS
ADVERTISEMENT
FOR KIDS

MONGABAY.COM


Share
|


