|
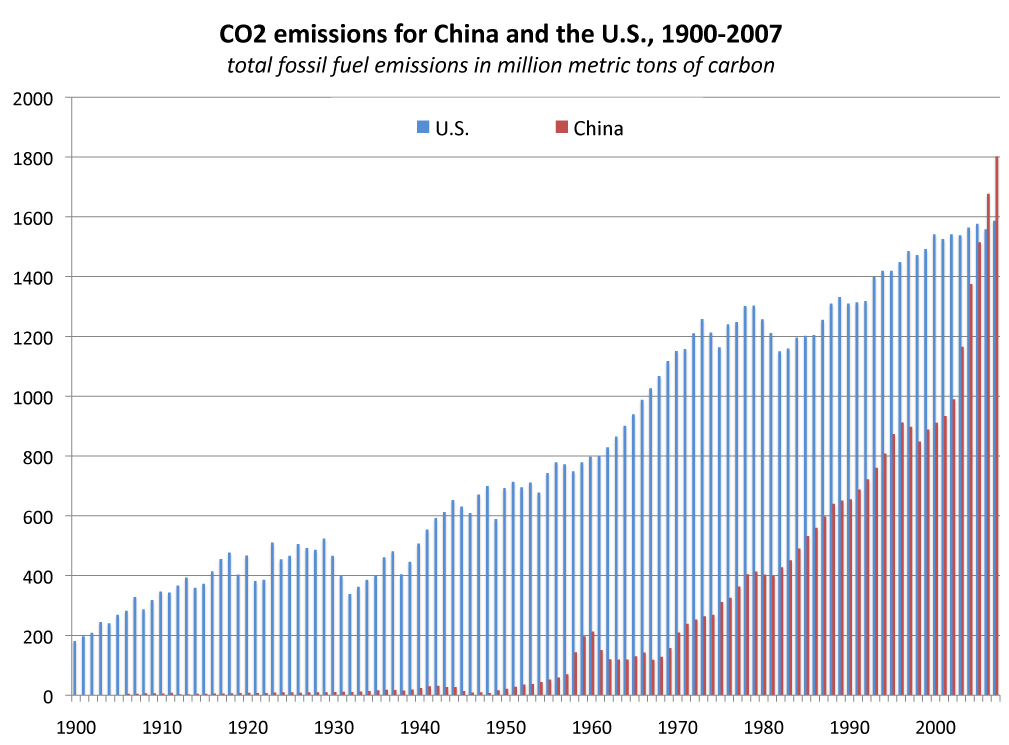
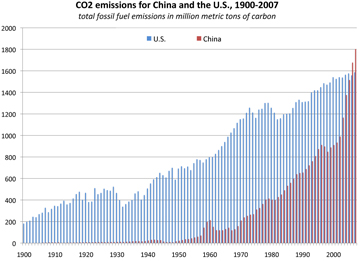
Graph: Carbon dioxide emissions for
countries of the world
Includes carbon emissions from fossil fuel combustion, cement manufacture, and gas flaring, but excludes emissions from Land Use, Land-Use Change and Forestry (LULUCF).
By country
Afghanistan |
Albania |
Algeria |
Angola |
Anguilla |
Antarctic Fisheries |
Antigua & Barbuda |
Argentina |
Armenia |
Aruba |
Australia |
Austria |
Azerbaijan |
Bahamas |
Bahrain |
Bangladesh |
Barbados |
Belarus |
Belgium & Luxembourg |
Belgium |
Belize |
Benin |
Bermuda |
Bhutan |
Bolivia |
Bosnia & Herzegovina |
Botswana |
Brazil |
British Virgin Islands |
Brunei (Darussalam) |
Bulgaria |
Burkina Faso |
Burundi |
Cambodia |
Canada |
Cape Verde |
Cat |
Cayman Islands |
Central African Republic |
Chad |
Chile |
China (Mainland) |
China Hong Kong Sar |
China |
Christmas Island |
Colombia |
Comoros |
Congo |
Cook Islands |
Costa Rica |
Cote D Ivoire |
Croatia |
Cuba |
Cyprus |
Czech Republic |
Czechoslovakia |
Democratic People S Republic of Korea |
Democratic Republic of the Congo (Formerly Zaire) |
Democratic Republic of Vietnam |
Denmark |
Djibouti |
Dominica |
Dominican Republic |
East & West Pakistan |
Ecuador |
Egypt |
El Salvador |
Equatorial Guinea |
Eritrea |
Estonia |
Ethiopia |
Faeroe Islands |
Falkland Islands (Malvinas) |
Federal Republic of Germany |
Federation of Malaya-Singapore |
Fiji |
Finland |
Former Democratic Yemen |
Former German Democratic Republic |
Former Panama Canal Zone |
Former Yemen |
France (Including Monaco) |
France |
French Equatorial Africa |
French Guiana |
French Indo-China |
French Polynesia |
French West Africa |
Gabon |
Gambia |
Georgia |
Germany |
Ghana |
Gibraltar |
Greece |
Greenland |
Grenada |
Guadeloupe |
Guatemala |
Guinea Bissau |
Guinea |
Guyana |
Haiti |
Honduras |
Hong Kong |
Hungary |
Iceland |
India |
Indonesia |
Iran |
Iraq |
Ireland |
Islamic Republic of Iran |
Israel |
Italy (Including San Marino) |
Italy |
Jamaica |
Japan (Excluding the Ruyuku Islands) |
Japan |
Jordan |
Kazakhstan |
Kenya |
Kiribati |
Kuwait |
Kuwaiti Oil Fires |
Kyrgyzstan |
Lao People S Democratic Republic |
Latvia |
Lebanon |
Leeward Islands |
Liberia |
Libyan Arab Jamahiriyah |
Lithuania |
Luxembourg |
Macau |
Macedonia |
Madagascar |
Malawi |
Malaysia |
Maldives |
Mali |
Malta |
Marshall Islands |
Martinique |
Mauritania |
Mauritius |
Mexico |
Mongolia |
Montserrat |
Morocco |
Mozambique |
Myanmar |
Namibia |
Nauru |
Nepal |
Netherland Antilles and Aruba |
Netherland Antilles |
Netherlands |
New Caledonia |
New Zealand |
Nicaragua |
Niger |
Nigeria |
Niue |
Norway |
Occupied Palestinian Territory |
Oman |
Pacific Islands (Palau) |
Pakistan |
Palau |
Panama |
Papua New Guinea |
Paraguay |
Peninsular Malaysia |
Peru |
Philippines |
Poland |
Portugal |
Puerto Rico |
Qatar |
Republic of Cameroon |
Republic of Ireland |
Republic of Korea |
Republic of Moldova |
Republic of South Vietnam |
Reunion |
Rhodesia-Nyasaland |
Romania |
Russian Federation |
Rwanda-Urundi |
Rwanda |
Ryukyu Islands |
Sabah |
Saint Helena |
Saint Lucia |
Samoa |
Sao Tome & Principe |
Sarawak |
Saudi Arabia |
Senegal |
Seychelles |
Sierra Leone |
Singapore |
Slovakia |
Slovenia |
Solomon Islands |
Somalia |
South Africa |
South Korea |
Spain |
Sri Lanka |
St. Kitts-Nevis-Anguilla |
St. Kitts-Nevis |
St. Pierre & Miquelon |
St. Vincent & the Grenadines |
Sudan |
Suriname |
Swaziland |
Sweden |
Switzerland |
Syrian Arab Republic |
Taiwan |
Tajikistan |
Tanganyika |
Thailand |
Timor-Leste (Formerly East Timor) |
Togo |
Tonga |
Trinidad and Tobago |
Tunisia |
Turkey |
Turkmenistan |
Uganda |
Ukraine |
United Arab Emirates |
United Kingdom |
United Korea |
United Republic of Tanzania |
United States of America |
Uruguay |
Ussr |
Uzbekistan |
Vanuatu |
Venezuela |
Viet Nam |
Wallis and Futuna Islands |
Western Sahara |
Yemen |
Yugoslavia (Former Socialist Federal Republic) |
Yugoslavia |
Zambia |
Zanzibar |
Zimbabwe
Data for top emitters
Countries with more than 1 million metric tons of CO2 emissions (273,000 tons of carbon) from fossil fuels combustion in any given year since 1975
[thousand metric tons of carbon]
| Country | | 1975 | | 1990 | | 2000 | | 2005 | | 2008 | | Change
1975-2005 | | Change
1990-2005 | | Change
2000-2005 | | Change
2000-2008 |
| Algeria | | 8735 | | 21515 | | 31869 | | 37685 | | 42382 | | 331% | | 75% | | 18% | | 12% |
| Argentina | | 25888 | | 30711 | | 38472 | | 43347 | | 53822 | | 67% | | 41% | | 13% | | 24% |
| Australia | | 47970 | | 79943 | | 89744 | | 99761 | | 96168 | | 108% | | 25% | | 11% | | -4% |
| Belgium | | 33299 | | 29342 | | 32022 | | 29834 | | 31351 | | -10% | | 2% | | -7% | | 5% |
| Brazil | | 41224 | | 56966 | | 90028 | | 95441 | | 110833 | | 132% | | 68% | | 6% | | 16% |
| Canada | | 108305 | | 122739 | | 146556 | | 152668 | | 153659 | | 41% | | 24% | | 4% | | 1% |
| China | | 312460 | | 658554 | | 928868 | | 1534244 | | 1922687 | | 391% | | 133% | | 65% | | 25% |
| Czech Republic (1) | | 62652 | | 59394 | | 31964 | | 31287 | | 30788 | | -50% | | -47% | | -2% | | -2% |
| Egypt | | 8481 | | 20711 | | 38541 | | 47313 | | 52336 | | 458% | | 128% | | 23% | | 11% |
| Former Yugoslavia | | 24433 | | 36356 | | N/A | | N/A | | N/A | | N/A | | N/A | | N/A | | N/A |
| France | | 121877 | | 108576 | | 100126 | | 107631 | | 103845 | | -12% | | -1% | | 7% | | -4% |
| Germany (2) | | 273917 | | 276425 | | 225605 | | 219177 | | 210480 | | -20% | | -21% | | -3% | | -4% |
| India | | 68786 | | 188344 | | 323647 | | 388321 | | 479039 | | 465% | | 106% | | 20% | | 23% |
| Indonesia | | 14716 | | 41032 | | 67068 | | 90212 | | 99648 | | 513% | | 120% | | 35% | | 10% |
| Iran | | 38082 | | 61954 | | 92512 | | 118919 | | 133961 | | 212% | | 92% | | 29% | | 13% |
| Italy | | 93351 | | 115925 | | 122079 | | 128220 | | 125015 | | 37% | | 11% | | 5% | | -2% |
| Japan | | 251158 | | 319704 | | 343695 | | 354597 | | 357534 | | 41% | | 11% | | 3% | | 1% |
| Kazakhstan | | N/A | | N/A | | 34848 | | 48338 | | 59016 | | N/A | | N/A | | 39% | | 22% |
| Malaysia | | 5303 | | 15433 | | 34525 | | 49992 | | 50515 | | 843% | | 224% | | 45% | | 1% |
| Mexico | | 43319 | | 104907 | | 104704 | | 117103 | | 124450 | | 170% | | 12% | | 12% | | 6% |
| Netherlands | | 41729 | | 45651 | | 46090 | | 47732 | | 46202 | | 14% | | 5% | | 4% | | -3% |
| Nigeria | | 12925 | | 12374 | | 21593 | | 31055 | | N/A | | 140% | | 151% | | 44% | | N/A |
| North Korea | | 29382 | | 66770 | | 20990 | | 22765 | | N/A | | -23% | | -66% | | 8% | | N/A |
| Pakistan | | 6332 | | 18698 | | 29030 | | 36561 | | 45093 | | 477% | | 96% | | 26% | | 23% |
| Poland | | 102430 | | 94876 | | 82139 | | 82791 | | 90072 | | -19% | | -13% | | 1% | | 9% |
| Romania | | 44251 | | 43323 | | 23918 | | 25052 | | 24404 | | -43% | | -42% | | 5% | | -3% |
| Russian Federation | | N/A | | N/A | | 393729 | | 413322 | | 435126 | | N/A | | N/A | | 5% | | 5% |
| Saudi Arabia | | 22726 | | 58646 | | 81197 | | 100100 | | 119374 | | 340% | | 71% | | 23% | | 19% |
| South Africa | | 50512 | | 90963 | | 100537 | | 111570 | | 120520 | | 121% | | 23% | | 11% | | 8% |
| South Korea | | 22247 | | 65901 | | 122071 | | 129322 | | 142230 | | 481% | | 96% | | 6% | | 10% |
| Taiwan | | 11868 | | 34345 | | 59373 | | 72452 | | 75066 | | 510% | | 111% | | 22% | | 4% |
| Thailand | | 6656 | | 26135 | | 54965 | | 73934 | | 76817 | | 1011% | | 183% | | 35% | | 4% |
| Turkey | | 17917 | | 39991 | | 60824 | | 67766 | | 80207 | | 278% | | 69% | | 11% | | 18% |
| Ukraine | | N/A | | N/A | | 83178 | | 89246 | | 84448 | | N/A | | N/A | | 7% | | -5% |
| United Arab Emirates | | 8473 | | 14948 | | 34566 | | 37007 | | 47871 | | 337% | | 148% | | 7% | | 29% |
| United Kingdom | | 164628 | | 156481 | | 149578 | | 150993 | | 148818 | | -8% | | -4% | | 1% | | -1% |
| United States | | 1220709 | | 1326725 | | 1565925 | | 1593086 | | 1547460 | | 31% | | 20% | | 2% | | -3% |
| USSR | | 817718 | | 1035386 | | N/A | | N/A | | N/A | | N/A | | N/A | | N/A | | N/A |
| Uzbekistan | | N/A | | N/A | | 32411 | | 30699 | | 36323 | | N/A | | N/A | | -5% | | 18% |
| Venezuela | | 17403 | | 33314 | | 39576 | | 41599 | | 52529 | | 139% | | 25% | | 5% | | 26% |
| Viet Nam | | 5945 | | 5838 | | 14616 | | 27774 | | N/A | | 367% | | 376% | | 90% | | #VALUE! |
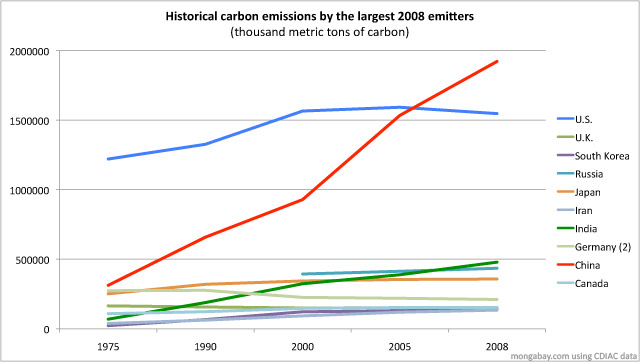
Top 10 carbon emitting countries in 1975
[thousand metric tons of carbon]
| Rank | Country | | 1975 |
| 1 | United States | | 1220709 |
| 2 | USSR | | 817718 |
| 3 | China | | 312460 |
| 4 | Germany (2) | | 273917 |
| 5 | Japan | | 251158 |
| 6 | United Kingdom | | 164628 |
| 7 | France | | 121877 |
| 8 | Canada | | 108305 |
| 9 | Poland | | 102430 |
| 10 | Italy | | 93351 |
Top 10 carbon emitting countries in 1990
[thousand metric tons of carbon]
| Rank | Country | | 1990 |
| 1 | United States | | 1326725 |
| 2 | USSR | | 1035386 |
| 3 | China | | 658554 |
| 4 | Japan | | 319704 |
| 5 | Germany (2) | | 276425 |
| 6 | India | | 188344 |
| 7 | United Kingdom | | 156481 |
| 8 | Canada | | 122739 |
| 9 | Italy | | 115925 |
| 10 | France | | 108576 |
Top 10 carbon emitting countries in 2005
[thousand metric tons of carbon]
| Rank | Country | | 2005 |
| 1 | United States | | 1593086 |
| 2 | China | | 1534244 |
| 3 | Russian Federation | | 413322 |
| 4 | India | | 388321 |
| 5 | Japan | | 354597 |
| 6 | Germany (2) | | 219177 |
| 7 | Canada | | 152668 |
| 8 | United Kingdom | | 150993 |
| 9 | South Korea | | 129322 |
| 10 | Italy | | 128220 |
Top 10 carbon emitting countries in 2008
[thousand metric tons of carbon]
| Rank | Country | | 2008 |
| 1 | China | | 1922687 |
| 2 | United States | | 1547460 |
| 3 | India | | 479039 |
| 4 | Russian Federation | | 435126 |
| 5 | Japan | | 357534 |
| 6 | Germany (2) | | 210480 |
| 7 | Canada | | 153659 |
| 8 | United Kingdom | | 148818 |
| 9 | South Korea | | 142230 |
| 10 | Iran | | 133961 |
 enlarge enlarge
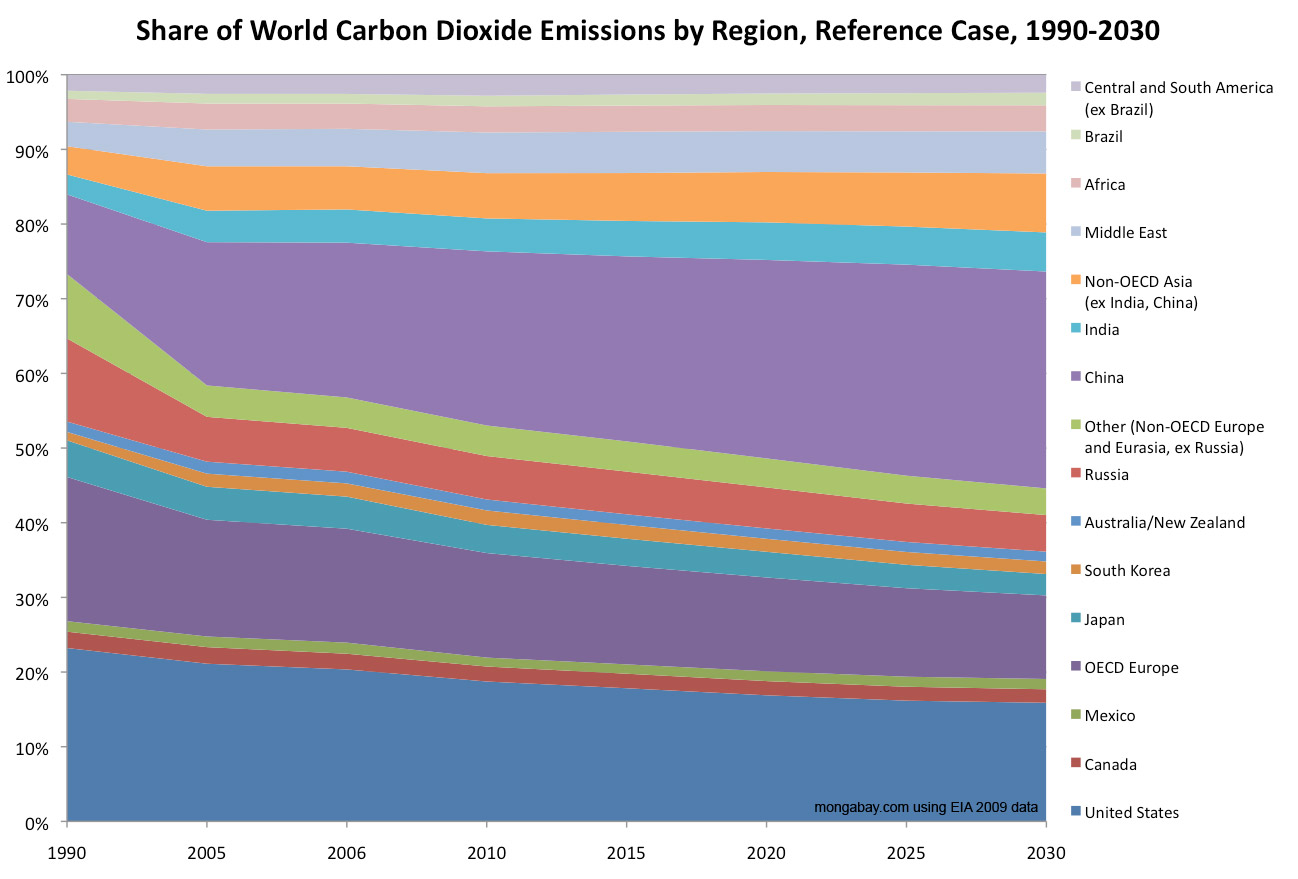
Projected emissions
Carbon Dioxide Emissions by Country, 1990-2030
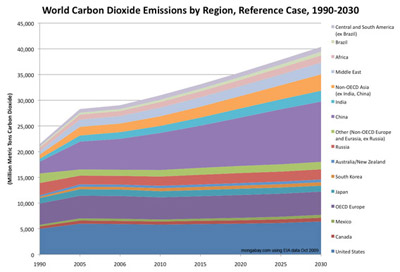 Click to enlarge Click to enlarge
According to the Energy Information Administration, after China and the United States, among major polluters only India is expected to have significant growth of emissions over the next 20 years.
Carbon Dioxide Emissions by Country, 1990-2030
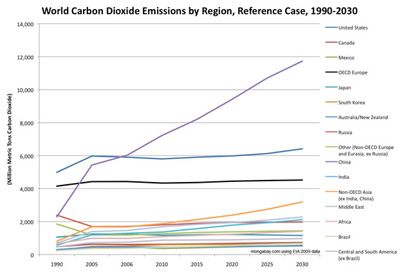 Click to enlarge Click to enlarge
According to the Department of Energy's (DOE) Energy Information Administration (EIA), after China and the United States, among major polluters only India is expected to have significant growth of emissions over the next 20 years.
Share of Carbon Dioxide Emissions by Country/Region, 1990-2030
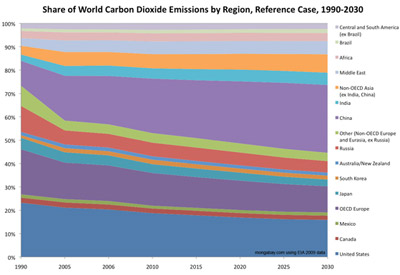 Click to enlarge Click to enlarge
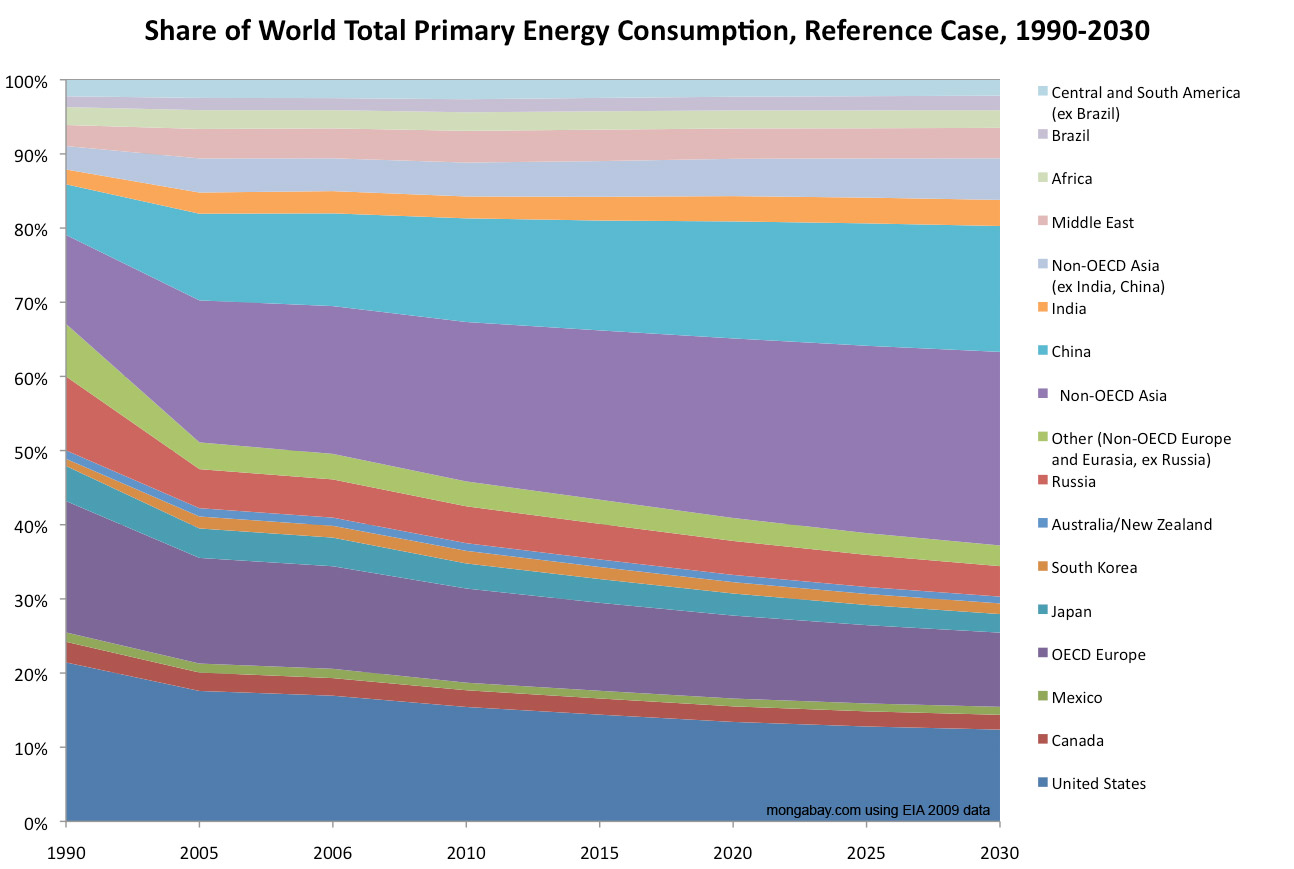
Share of World Total Primary Energy Consumption by Region, Reference Case, 1990-2030 (Quadrillion Btu)
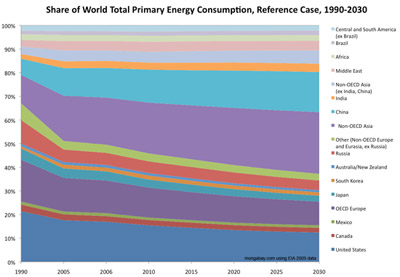 Click to enlarge Click to enlarge
All table data from the Carbon Dioxide Information Analysis Center at the Oak Ridge National Laboratory. Data excludes emissions from land use and agriculture (including deforestation).
CITATION: Tom Boden, Gregg Marland, Robert J. Andres. Global CO2 Emissions from Fossil-Fuel Burning, Cement Manufacture, and Gas Flaring: 1751-2006. Carbon Dioxide Information Analysis Center, Oak Ridge National Laboratory; Oak Ridge, Tennessee. April 29, 2009. doi 10.3334/CDIAC/00001
|
|
|
About this site
Providing tropical forest news, statistics, photos, and information, worldrainforests.com is the world's most popular rainforest site. [more]
|
Weekly Newsletter
Mongabay will never distribute your email address or send spam.
|
|