|
Projected GDP, 1990-2030
|
|
|
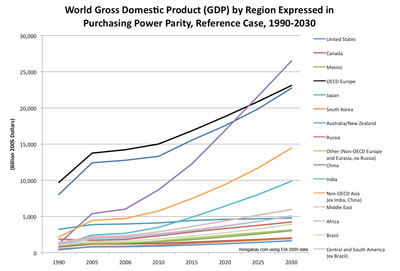
World Gross Domestic Product (GDP) by Region Expressed in Purchasing Power Parity, Reference Case, 1990-2030 [line chart/graph]
 Click to enlarge Click to enlarge
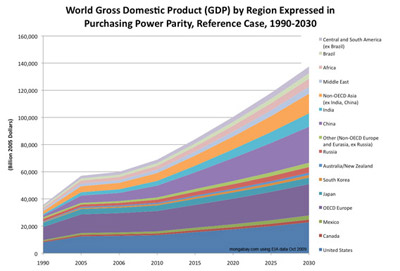
World Gross Domestic Product (GDP) by Region Expressed in Purchasing Power Parity, Reference Case, 1990-2030 [area chart/graph]
 Click to enlarge Click to enlarge
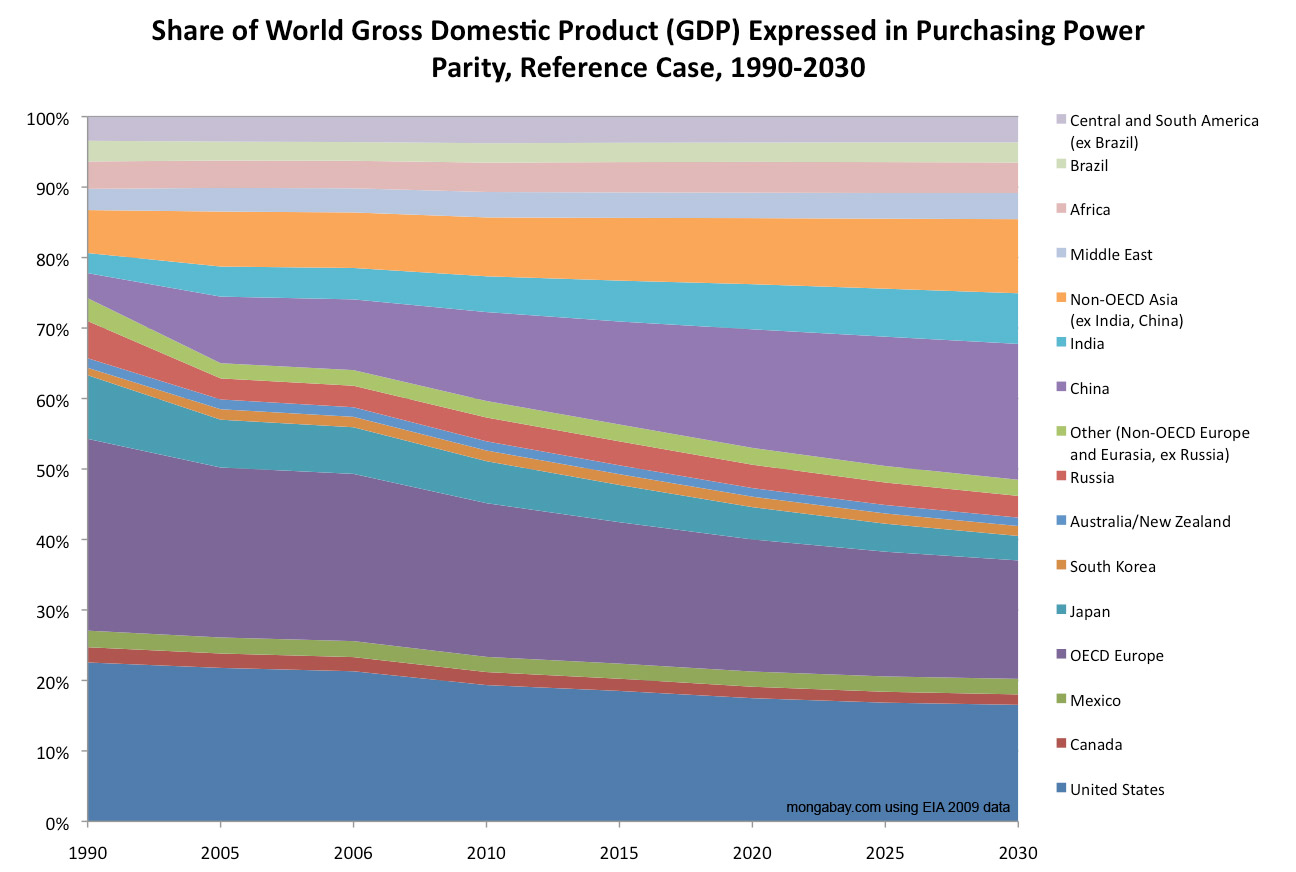
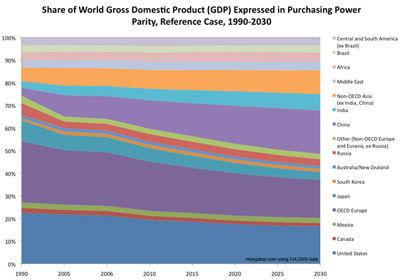
Share of World Gross Domestic Product (GDP) by Region Expressed in Purchasing Power Parity, Reference Case, 1990-2030 [line chart/graph]
 Click to enlarge Click to enlarge
Data derived from the Department of Energy (DOE) Energy Information Administration (EIA) 2009.
Other charts:
Carbon dioxide (CO2) |
GDP |
Energy |
Coal |
Renewables |
Nuclear |
|
|
|
|