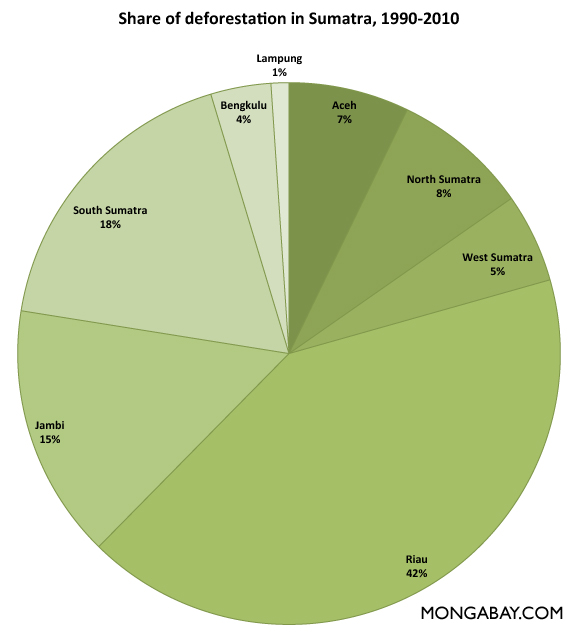
| Total | Degraded | Primary | Total | Degraded | Primary | Total | Degraded | Primary |
Aceh | 3.86 | 1.78 | 2.08 | 3.43 | 1.81 | 1.62 | 3.32 | 1.79 | 1.53 | North Sumatra | 2.53 | 2.12 | 0.41 | 2.12 | 1.76 | 0.35 | 1.92 | 1.69 | 0.24 | West Sumatra | 2.69 | 1.96 | 0.73 | 2.4 | 1.73 | 0.67 | 2.29 | 1.7 | 0.59 | Riau | 5.67 | 4.18 | 1.49 | 3.8 | 3.49 | 0.32 | 2.53 | 2.29 | 0.23 | Jambi | 2.65 | 1.94 | 0.71 | 1.82 | 1.4 | 0.41 | 1.51 | 1.11 | 0.4 | South Sumatra | 2.28 | 1.97 | 0.31 | 0.99 | 0.71 | 0.28 | 0.94 | 0.67 | 0.27 | Bengkulu | 1.04 | 0.47 | 0.57 | 0.81 | 0.34 | 0.46 | 0.77 | 0.32 | 0.45 | Lampung | 0.39 | 0.31 | 0.09 | 0.32 | 0.23 | 0.09 | 0.31 | 0.23 | 0.08 | Total | 21.11 | 14.73 | 6.39 | 15.69 | 11.48 | 4.21 | 13.58 | 9.79 | 3.79 | |