|
|

|
|
BIOME CHARTS |
|
|
Deforestation Estimates
What is the global deforestation rate? What is the deforestation rate in South America? Which region loses the most forest each year?
With the advent of satellites, these questions seem like they should be easy to answer. Yet, estimates of deforestation remain variable depending on a number of factors, including the definition of what constitutes forest, the scale, and the methodology used. Below are some recent estimates on deforestation at various scales and for various forest types. The source of each estimate is also listed.
Please check back for updates.
Also you might find these tools useful:
How much forest is there?
Before we get to deforestation, it's important to first establish how much forest cover exists on planet Earth.
Global forest cover (FAO 2010) [related story]
| Region | Forest cover (M ha) | % of land cover | % change since 2000 |
| Africa | 674.419 | 23 | -10 |
| Asia | 592.512 | 19 | 3 |
| Europe | 1005.001 | 45 | 2 |
| North and Central America | 705.393 | 33 | 0 |
| Oceania | 191.384 | 23 | -4 |
| South America | 864.351 | 49 | -9 |
| World | 4033 | 31 | -3 |
Estimates of World Forest Cover
Types of Forest Worldwide
| Forest type | Forest cover (M ha) | % of forest cover | year | Source |
| Tropical | 1623.6 | 44 | 2010 | FAO 2011 |
| Boreal | 1254.6 | 34 | 2010 | FAO 2011 |
| Temperate | 479.7 | 13 | 2010 | FAO 2011 |
| Sub-tropical | 332.1 | 9 | 2010 | FAO 2011 |

Map of the six regions used in this survey AND Distribution of global forest area (2005) by region. Chart from the UN FAO's Global forest land-use change from 1990 to 2005: Initial results from a global remote sensing survey.

Map of the five broad climatic domains AND Distribution of global forest area (2005) by
climatic domain. Chart from the UN FAO's Global forest land-use change from 1990 to 2005: Initial results from a global remote sensing survey.
Status of Global Forests
| Status | Forest cover (M ha) | % of forest cover | year | Source |
| Primary forest cover | 1350 | 36 | 2010 | FAO 2010 |
| Secondary forest cover | 2150 | 57 | 2010 | FAO 2010 |
| Planted forests | 264 | 7 | 2010 | FAO 2010 |
Macro-scale deforestation estimates
| Region / type | Period | Forest cover (M ha/yr) | Source |
| Gross global forest loss | 1990-2000 | 14.2 | FAO 2011 |
| Gross global forest loss | 2000-2005 | 15.2 | FAO 2011 |
| Global forests | 1990-2000 | 16 | FAO 2010 (old) |
| Global forests | 2000-2010 | 13 | FAO 2010 (old) |
| Global primary forests | 1990-2000 | 4.7 | FAO 2010 |
| Global primary forests | 2000-2010 | 4.2 | FAO 2010 |
| Net deforestation | 1990-2005 | 4.9 | FAO 2011 |
| Net deforestation | 1990-2000 | 4.1 | FAO 2011 |
| Net deforestation | 2000-2005 | 6.4 | FAO 2011 |
| Net deforestation | 1990-2000 | 8.3 | FAO 2010 (old) |
| Net deforestation | 2000-2010 | 5.2 | FAO 2010 (old) |
| Tropical forests | 1990-2000 | 11.33 | FAO 2010 |
| Tropical forests | 2000-2010 | 9.34 | FAO 2010 |
| Net tropical deforestation | 1990-2000 | 6.3 | FAO 2011 |
| Net tropical deforestation | 2000-2005 | 8 | FAO 2011 |
| Gross tropical deforestation | 1990-2000 | 8.2 | FAO 2011 |
| Gross tropical deforestation | 2000-2005 | 10 | FAO 2011 |
Macro-scale reforestation and forest recovery estimates
| Region / type | Period | Forest cover (M ha/yr) | Source |
| Afforestation, natural forest expansion | 1990-2000 | 10.1 | FAO 2011 |
| Afforestation, natural forest expansion | 2000-2005 | 8.8 | FAO 2011 |
Regional-scale deforestation estimates

Annual change in forest area (1990-2000 and 2000-2005) by climatic domain. Chart from the UN FAO's Global forest land-use change from 1990 to 2005: Initial results from a global remote sensing survey.

Annual change in forest land-use area (1990-2000 and 2000-2005) by region. Chart from the UN FAO's Global forest land-use change from 1990 to 2005: Initial results from a global remote sensing survey.
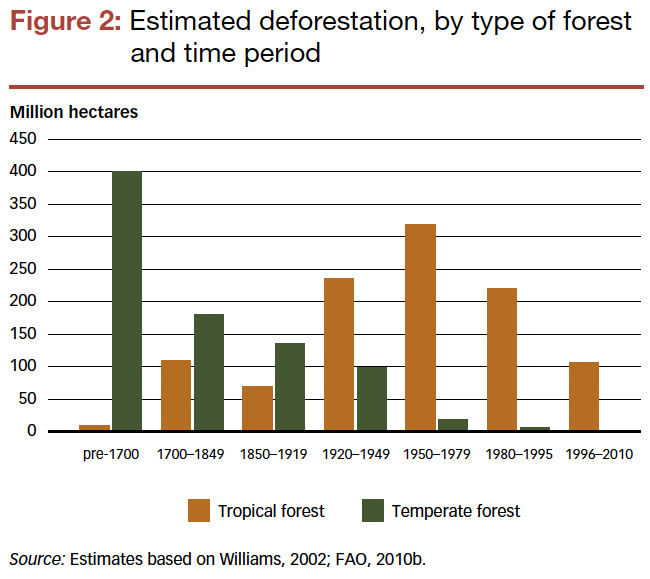
How much forest has been cut down in the history of civilizations?
In his excellent Deforesting the earth: from
prehistory to global crisis, Williams estimates that humans have cleared some 1.8 billion hectares over the past 5,000 years, or an average net loss of 360,000 hectares per year.

Estimated deforestation, by type of forest and time period. Chart from the UN FAO's State of the World�s Forests 2012.
World population and cumulative deforestation, 1800 to 2010. Graph from the UN FAO's State of the World�s Forests 2012.
|
|
|
|
|

