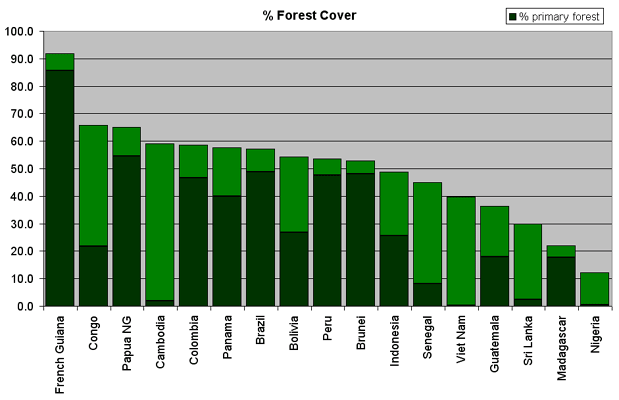
 Percent primary forest cover, 2005
Statistics from 17 tropical countries for which the United Nations has somewhat reliable figures for primary forest cover. Total deforestation statistics typically fail to distinguish between general deforestation, reforestation through plantations, and the loss of biologically important primary forests (also called old-growth forests). Looking at primary forest loss figures for these countries reveals an alarming increase in deforestation of these endangered ecosystems.
| Region | Total land | Total forest cover | Primary forest cover | |||||||||||||||||||||||||||||||
| Area | Area, 2005 | Area, 2005 | Annual change 1990-2005 | Total change 1990-2005 | Annual Change 1990-2000 | Annual Change 2000-2005 | Area, 2005 | Area, 2005 | Annual change 1990-2005 | Total change 1990-2005 | Annual Change 1990-2000 | Annual Change 2000-2005 | Rate of Change 1990-2000 vs 2000-2005 | |||||||||||||||||||||
| Country | (1000 ha) | (1000 ha) | % | ha | % | % | % | (1000 ha) | % | ha | % | % | % | % | ||||||||||||||||||||
| French Guiana | 9,000 | 8,063 | 91.8 | -1867 | -0.3 | -0.03 | 0.00 | 7,701 | 85.6 | -13867 | -2.6 | -0.19 | -0.15 | -17.37 | ||||||||||||||||||||
| Papua New Guinea | 46,284 | 29,437 | 65 | -139067 | -6.6 | -0.44 | -0.46 | 25,211 | 54.5 | -266600 | -13.7 | -0.94 | -0.95 | 0.50 | ||||||||||||||||||||
| Brazil | 851,488 | 477,698 | 57.2 | -2821933 | -8.1 | -0.52 | -0.63 | 415,890 | 48.8 | -2974867 | -9.7 | -0.59 | -0.80 | 34.99 | ||||||||||||||||||||
| Brunei | 577 | 278 | 52.8 | -2333 | -11.2 | -0.80 | -0.69 | 278 | 48.2 | -2333 | -11.2 | -0.80 | -0.69 | -13.06 | ||||||||||||||||||||
| Peru | 128,522 | 68,742 | 53.7 | -94267 | -2.0 | -0.13 | -0.14 | 61,065 | 47.5 | -123000 | -2.9 | -0.11 | -0.36 | 214.69 | ||||||||||||||||||||
| Colombia | 113,891 | 60,728 | 58.5 | -47400 | -1.2 | -0.08 | -0.08 | 53,062 | 46.6 | -52800 | -1.5 | -0.09 | -0.11 | 11.03 | ||||||||||||||||||||
| Panama | 7,552 | 4,294 | 57.7 | -5467 | -1.9 | -0.16 | -0.06 | 3,023 | 40.0 | -45533 | -18.4 | -1.26 | -1.33 | 5.84 | ||||||||||||||||||||
| Bolivia | 109,858 | 58,740 | 54.2 | -270333 | -6.5 | -0.43 | -0.45 | 29,360 | 26.7 | -135200 | -6.5 | -0.43 | -0.45 | 4.50 | ||||||||||||||||||||
| Indonesia | 190,457 | 88,495 | 48.8 | -1871467 | -24.1 | -1.61 | -1.91 | 48,702 | 25.6 | -1447800 | -30.8 | -2.06 | -2.59 | 25.88 | ||||||||||||||||||||
| Congo | 34,200 | 22,471 | 65.8 | -17000 | -1.1 | -0.07 | -0.08 | 7,464 | 21.8 | -5600 | -1.1 | -0.07 | -0.07 | 0.75 | ||||||||||||||||||||
| Guatemala | 10,889 | 3,938 | 36.3 | -54000 | -17.1 | -1.14 | -1.28 | 1,957 | 18.0 | -26800 | -17.0 | -1.14 | -1.28 | 12.82 | ||||||||||||||||||||
| Madagascar | 58,704 | 12,838 | 22.1 | -56933 | -6.2 | -0.49 | -0.28 | 10,347 | 17.6 | -10400 | -1.5 | -0.12 | -0.07 | -43.61 | ||||||||||||||||||||
| Senegal | 19,672 | 8,673 | 45 | -45000 | -7.2 | -0.48 | -0.51 | 1,598 | 8.1 | -10733 | -9.2 | -0.60 | -0.67 | 10.43 | ||||||||||||||||||||
| Sri Lanka | 6,561 | 1,933 | 29.9 | -27800 | -17.7 | -1.14 | -1.43 | 167 | 2.5 | -6000 | -35.0 | -2.33 | -3.05 | 30.46 | ||||||||||||||||||||
| Cambodia | 18,104 | 10,447 | 59.2 | -166600 | -19.3 | -1.09 | -1.90 | 322 | 1.8 | -29600 | -58.0 | -4.05 | -5.88 | 45.22 | ||||||||||||||||||||
| Nigeria | 92,377 | 11,089 | 12.2 | -409667 | -35.7 | -2.38 | -3.12 | 326 | 0.4 | -82000 | -79.0 | -5.27 | -11.14 | 111.41 | ||||||||||||||||||||
| Viet Nam | 33,169 | 12,931 | 39.7 | 237867 | 38.1 | 2.52 | 2.06 | 85 | 0.3 | -19933 | -77.9 | -5.13 | -10.91 | 112.64 | ||||||||||||||||||||
| Total | 1,731,305 | 880,795 | 43.5 | -5793267 | -8.3 | -0.57 | -0.62 | 666558 | 38.5 | -5253067 | -10.6 | -0.67 | -0.84 | 25.6 | ||||||||||||||||||||