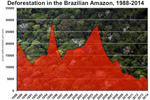
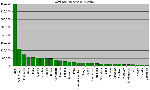
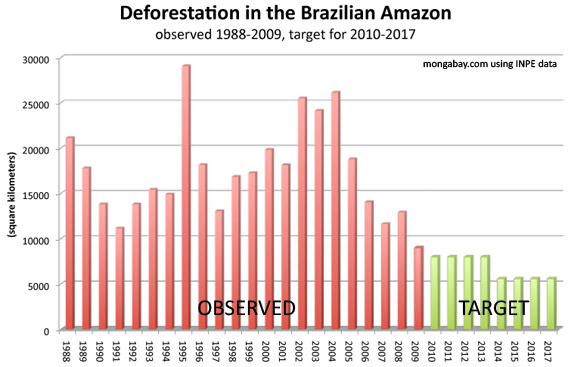
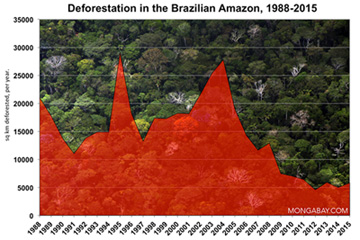
[ large medium small ] | Deforestation in the Brazlian Amazon, 1988-present
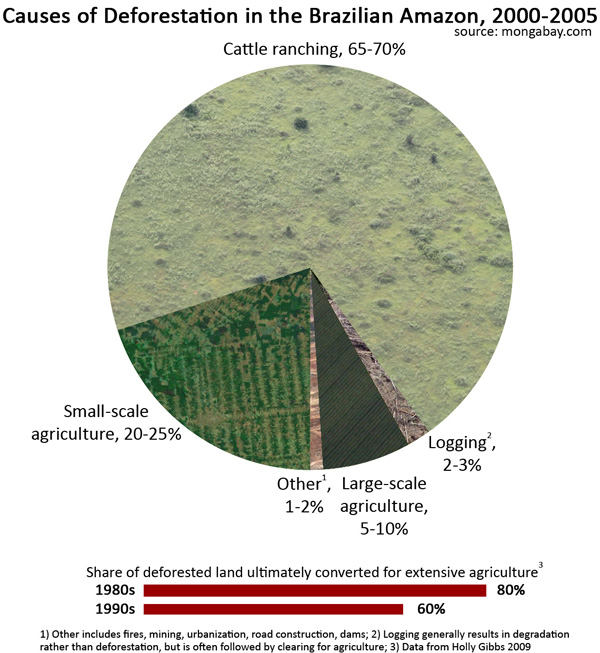
60-70 percent of deforestation in the Amazon results from cattle ranches while the rest mostly results from small-scale subsistence agriculture. Despite the widespread press attention, large-scale farming (i.e. soybeans) currently contributes relatively little to total deforestation in the Amazon. Most soybean cultivation takes place outside the rainforest in the neighboring cerrado grassland ecosystem and in areas that have already been cleared. Logging results in forest degradation but rarely direct deforestation. However, studies have showed a close correlation between logging and future clearing for settlement and farming.
context
of image |
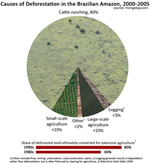
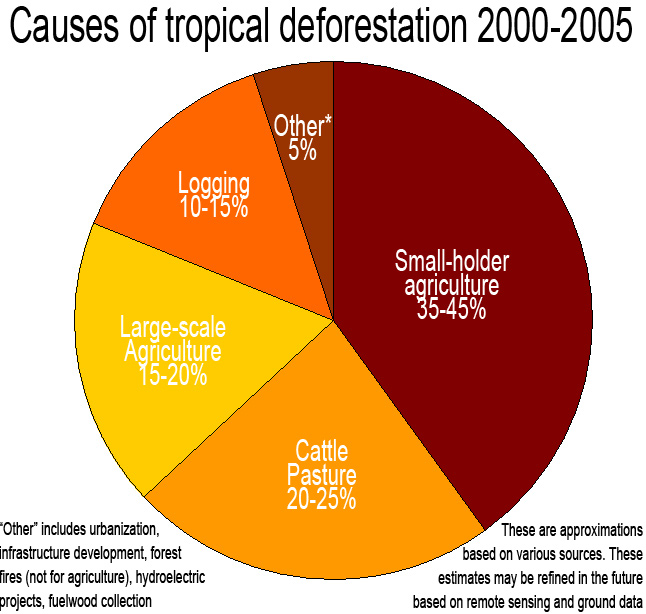
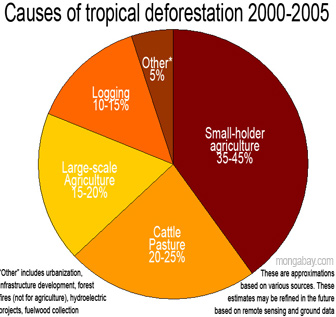
[ large medium small ] | Causes of deforestation in the Brazilian Amazon, 2000-2005
The above pie chart showing deforestation in the Amazon by cause is based on the median figures for estimate ranges. Please note the low estimate for large-scale agriculture. Between 2000-2005 soybean cultivation reesulted in a small overall percentage of direct deforestation. Nevertheless the role of soy is quite significant in the Amazon. As explained by Dr. Philip Fearnside, "Soybean farms cause some forest clearing directly. But they have a much greater impact on deforestation by consuming cleared land, savanna, and transitional forests, thereby pushing ranchers and slash-and-burn farmers ever deeper into the forest frontier. Soybean farming also provides a key economic and political impetus for new highways and infrastructure projects, which accelerate deforestation by other actors."
context
of image |
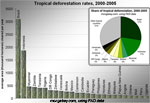
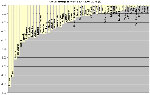
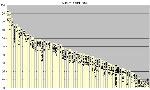
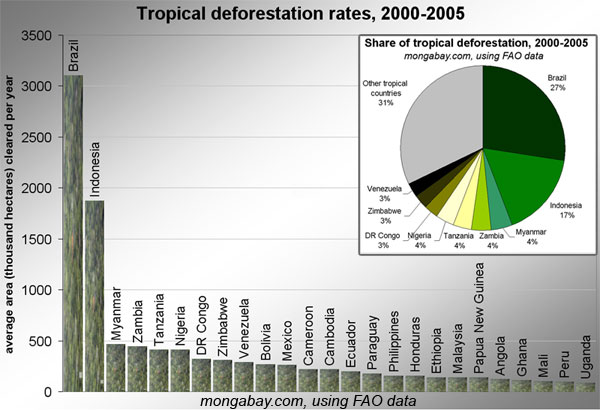
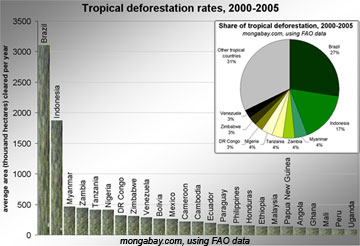
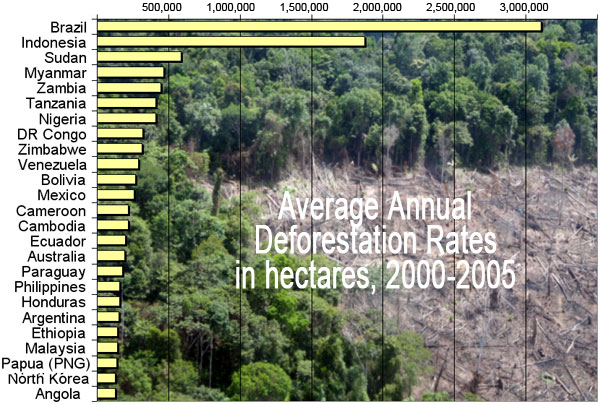
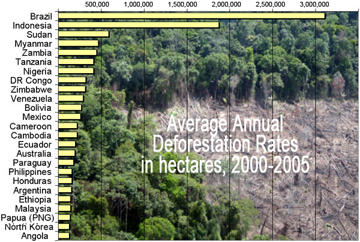
[ large medium small ] | Tropical deforestation rates from 2000-2005
Tropical deforestation rates from 2000-2005, ranked in decending order by the highest amount of average annual forest loss for 25 countries based on data from the U.N. Food and Agriculture Organization (FAO).
context
of image |
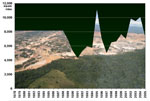
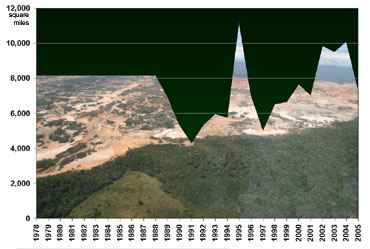
[ medium small ] | Deforestation in Brazil, 1978-2005
context
of image |
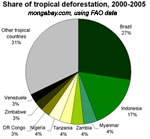
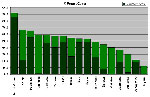
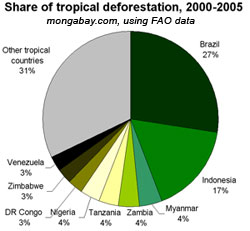
[ large medium small ] | Share of tropical deforestation, 2005-2005
|
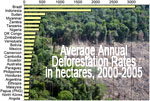
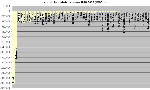
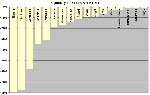
[ large medium small ] | Average annual deforestation rate in hectares, 2000-2005
context
of image |
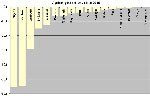
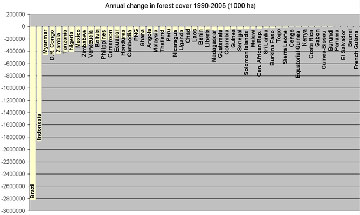
[ large medium small ] | Annual change in forest cover, 1990-2005
Annual change in forest cover, 1990-2005, for 25 tropical countries (by area in 1000 hectares)
context
of image |
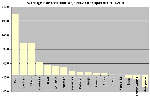
[ large medium small ] | Total percent change in forest cover, 1990-2005
Total percent change in forest cover, 1990-2005, for selected tropical countries (%)
context
of image |
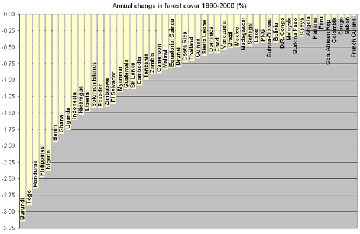
[ large medium small ] | Annual percentage change in forest cover, 1990-2000
Average annual percentage change in forest cover, 1990-2000, for various tropical countries
context
of image |
[ large medium small ] | Annual percentage change in forest cover, 2000-2005
Average annual percentage change in forest cover, 2000-2005, for various tropical countries
context
of image |
no thumbnail>
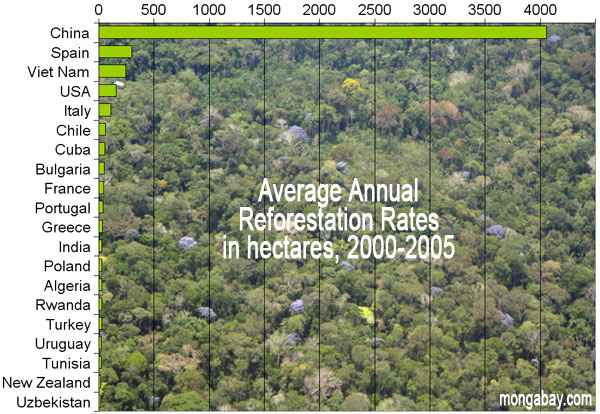
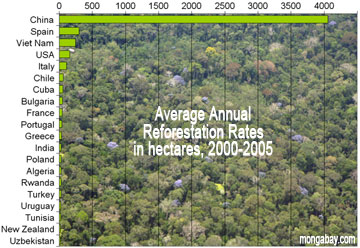
[ large medium ] | Average annual reforestation rate in hectares, 2000-2005
context
of image |
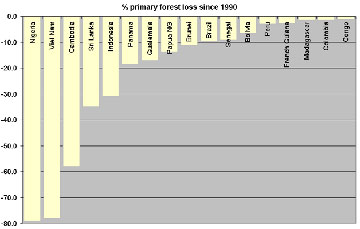
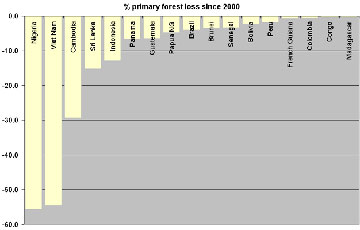
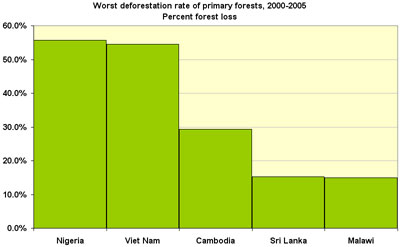
[ large medium small ] | Total percentage loss of primary forest, 1990-2005
Statistics from 17 tropical countries for which the United Nations has somewhat reliable figures for primary forest cover. Total deforestation statistics typically fail to distinguish between general deforestation, reforestation through plantations, and the loss of biologically important primary forests (also called old-growth forests). Looking at primary forest loss figures for these countries reveals an alarming increase in deforestation of these endangered ecosystems.
context
of image |
[ large medium small ] | Primary forest deforestation, 2000-2005
Statistics from 17 tropical countries for which the United Nations has somewhat reliable figures for primary forest cover. Total deforestation statistics typically fail to distinguish between general deforestation, reforestation through plantations, and the loss of biologically important primary forests (also called old-growth forests). Looking at primary forest loss figures for these countries reveals an alarming increase in deforestation of these endangered ecosystems.
context
of image |
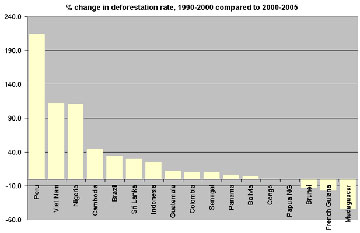
[ large medium small ] | Rate of change of primary forest loss, 1990-2005
Statistics from 17 tropical countries for which the United Nations has somewhat reliable figures for primary forest cover. Total deforestation statistics typically fail to distinguish between general deforestation, reforestation through plantations, and the loss of biologically important primary forests (also called old-growth forests). Looking at primary forest loss figures for these countries reveals an alarming increase in deforestation of these endangered ecosystems.
context
of image |
no thumbnail>
[ medium ] | Worst deforestation rate of natural forests, 2000-2005
context
of image |
no thumbnail>
[ large ] | Highest deforestation of natural forests, 2000-2005. All countries.
context
of image |
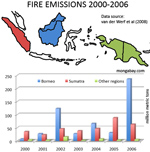
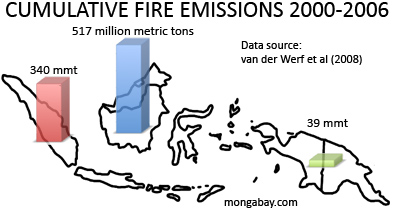
[ large small ] | Annual fire emissions from Borneo, Sumatra, and New Guinea from 2000-2006
Data source: van der Werf et al 2008.
context
of image |
[ large small ] | Cumulative fire emissions from Borneo, Sumatra, and New Guinea from 2000-2006
Data source: van der Werf et al 2008.
context
of image |
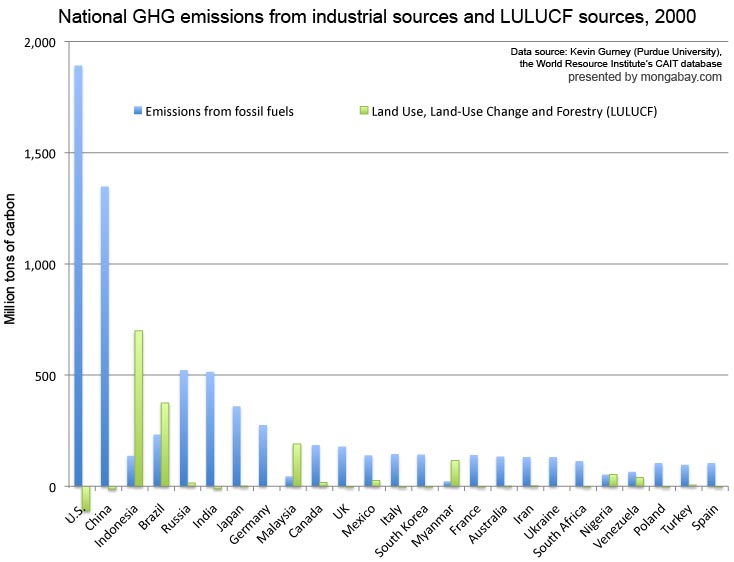
[ large medium small ] | National GHG emissions from industrial sources (electricity generation, transportation, buildings, etc) and LULUCF, 2000
Note that some countries have negative emissions from LULUCF meaning they these sources are a net carbon sink. Also note that the E.U. is listed in addition to its individual member countries.
context
of image |
no thumbnail
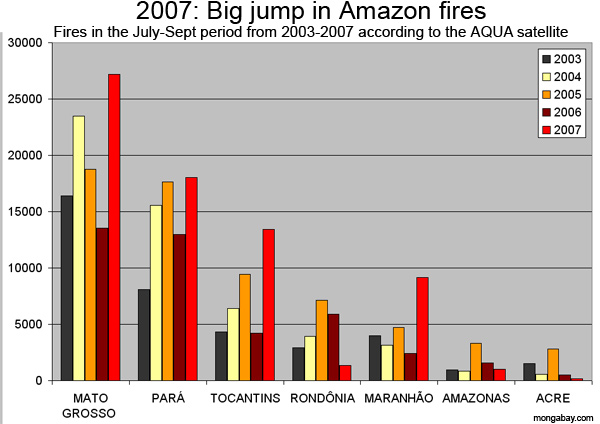
[ large medium] | 2003-2007 Amazon fires
Number of fires in Brazilian Amazon states, monthly comparison for 2003, 2004, 2005, 2006, and 2007 using AQUA satellite data
context
of image |
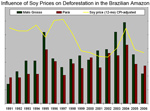
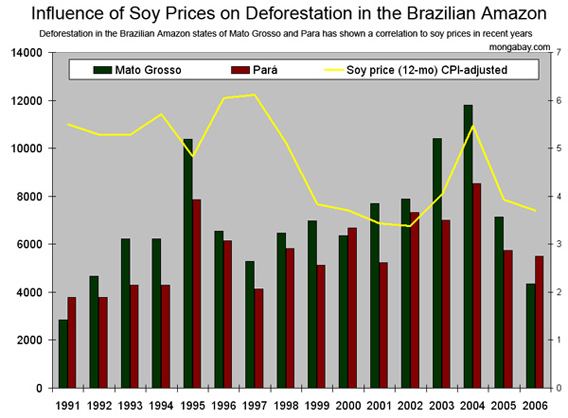
[ large small ] | Influence of soy prices on deforestation in the Brazilian Amazon
Influence of soy prices (CPI-adjusted, 12-month moving average) on deforestation in the Brazilian Amazon. Deforestation in the states of Mato Grosso and Para has shown a particularly strong correlation to soy prices in recent years. All figures in hectares (2.47 acres).
context
of image |
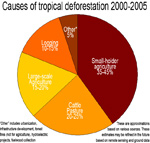
[ large medium small ] | Causes of deforestation, 2000-2005
Pie chart breakdown by source of the causes of deforestation
context
of image |
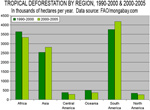
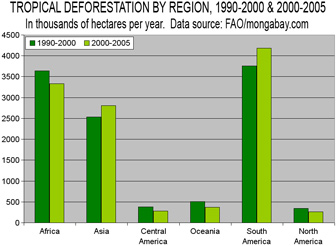
[ large medium small ] | Regional deforestation
Tropical deforestation by region
context
of image |
no thumbnail
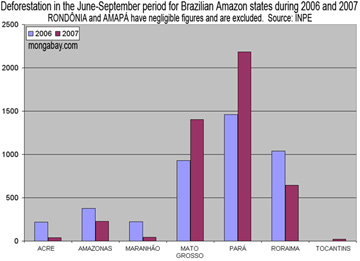
[ large medium] | June-September deforestation in Brazilian Amazon states, 2006 versus 2007
June-September deforestation in Brazilian Amazon states, 2006 versus 2007. Note that Rond�nia and Amap� are excluded due to low forest loss in each year. Source: INPE
context
of image |
no thumbnail
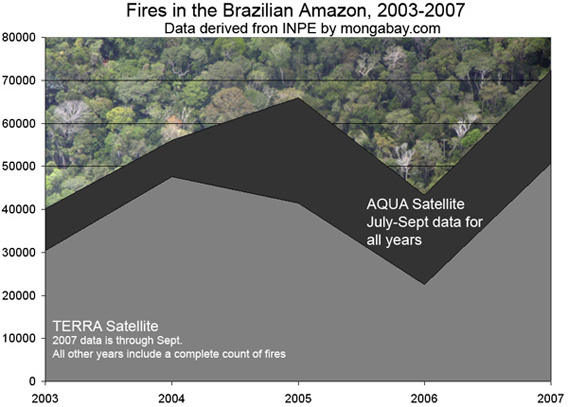
[ large] | Fires in the Brazilian Amazon, 2003-2007
INPE data
context
of image |
no thumbnail
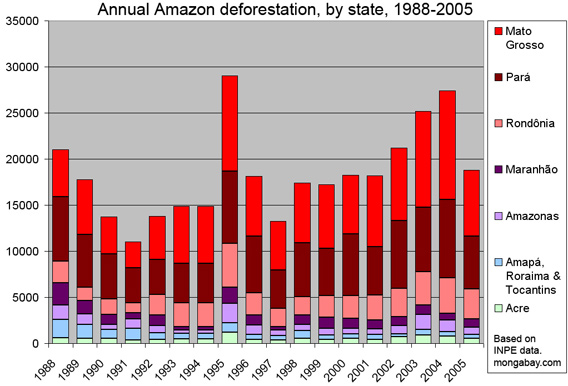
[ large medium small ] | Annual Amazon deforestation by state 1988-2005
Annual Amazon deforestation by state 1988-2005
context
of image |
no thumbnail>
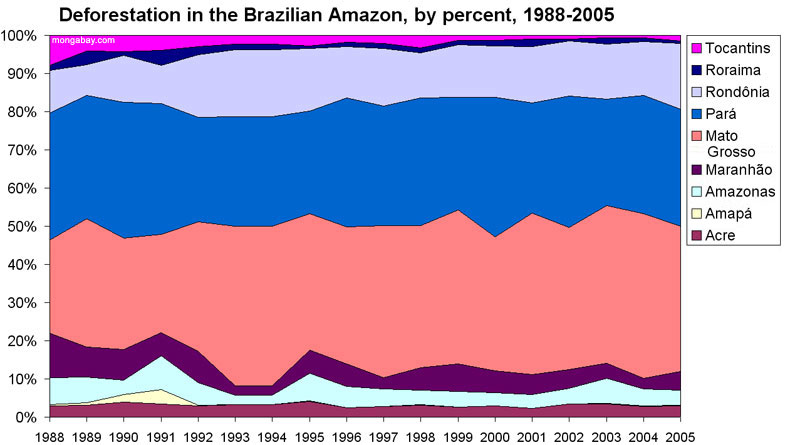
[ large medium ] | Deforestation in Amaz�nia Legal State, Brazil, 1988-2005
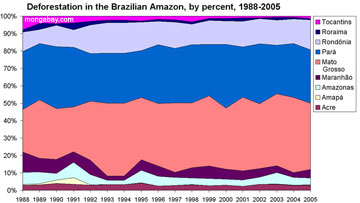
Deforestation in Amaz�nia Legal State, Brazil, 1988-2005 measured stated-by-state by percent share of total forest loss
context
of image |
no thumbnail>
[ large medium ] | Deforestation in Amaz�nia Legal State, Brazil, 1988-2005
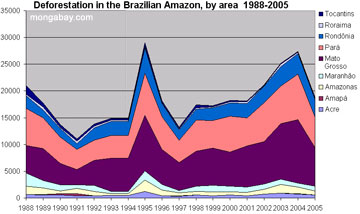
Deforestation in Amaz�nia Legal State, Brazil, 1988-2005 State-by-state contribution to total forest loss
context
of image |
no thumbnail>
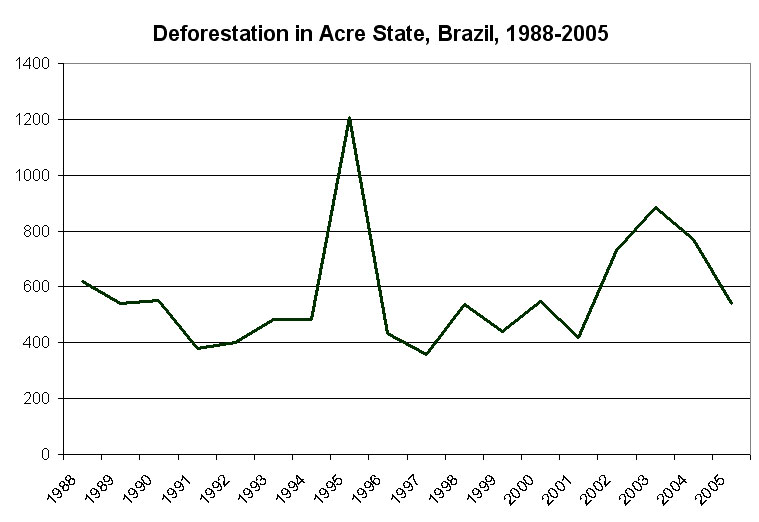
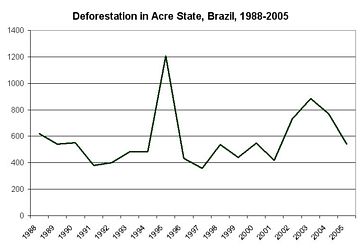
[ large medium ] | Deforestation in Acre State, Brazil, 1988-2005
context
of image |
no thumbnail>
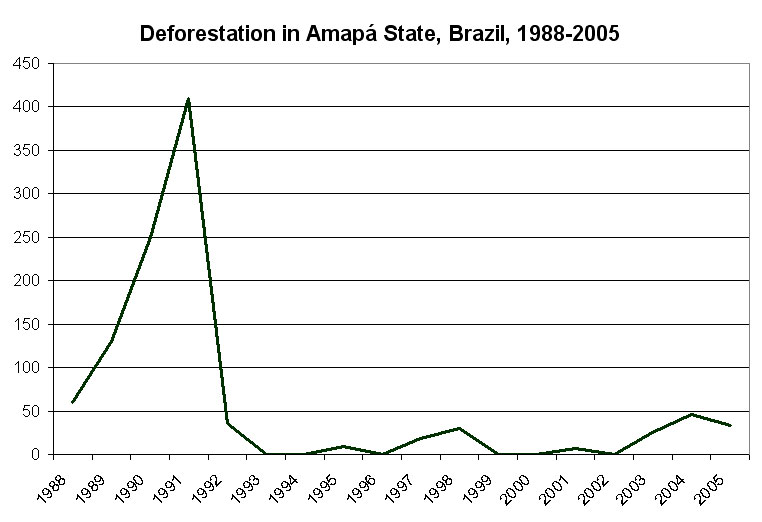
[ large medium ] | Deforestation in Amap� State, Brazil, 1988-2005
context
of image |
no thumbnail>
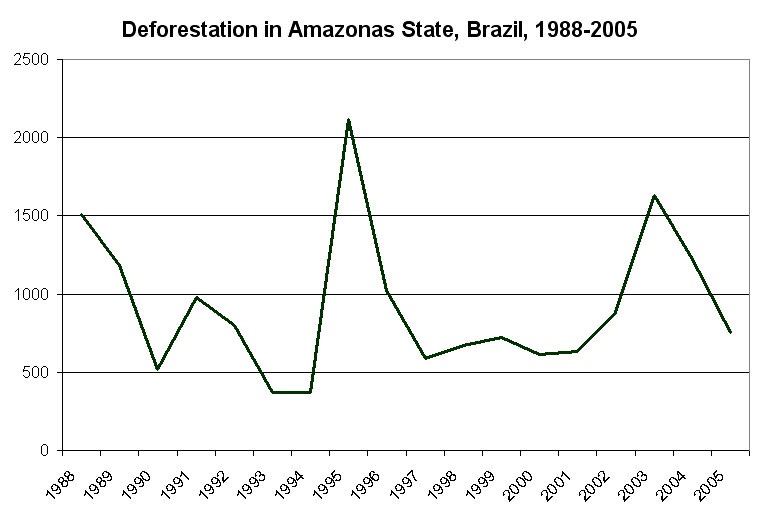
[ large medium ] | Deforestation in Amazonas State, Brazil, 1988-2005
context
of image |
no thumbnail>
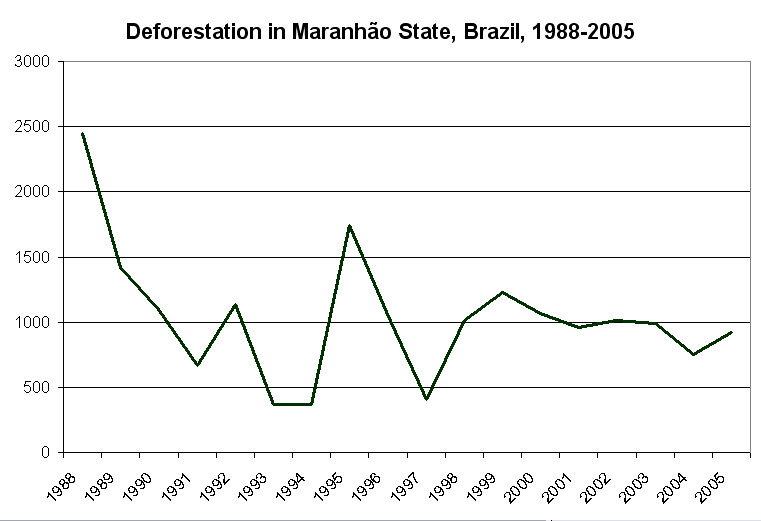
[ large medium ] | Deforestation in Maranh�o State, Brazil, 1988-2005
context
of image |
no thumbnail>
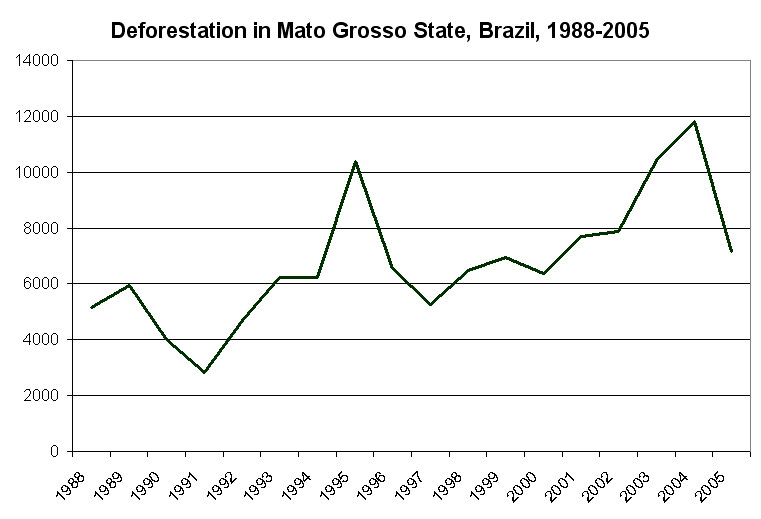
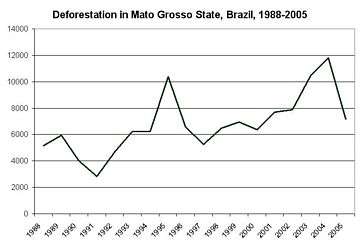
[ large medium ] | Deforestation in Mato Grosso State, Brazil, 1988-2005
context
of image |
no thumbnail>
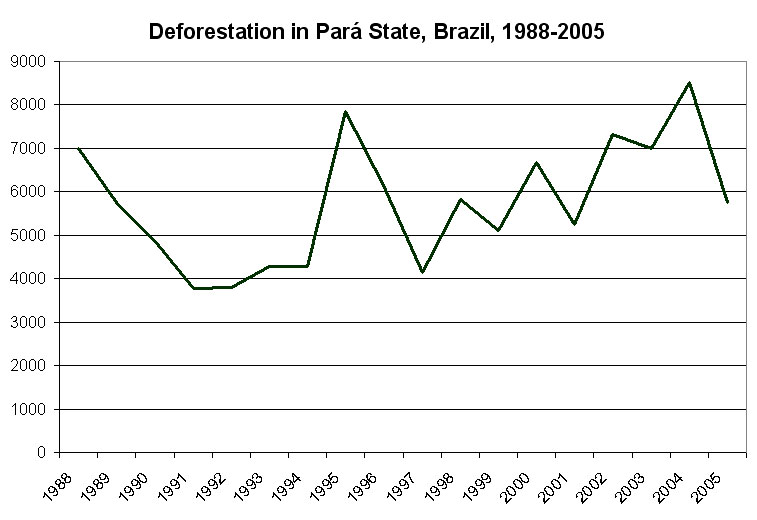
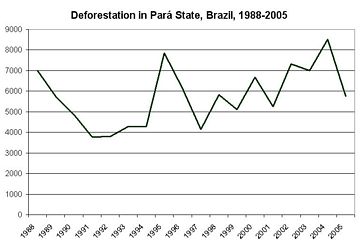
[ large medium ] | Deforestation in Par� State, Brazil, 1988-2005
context
of image |
no thumbnail>
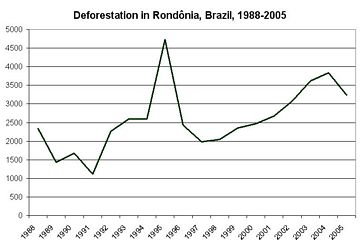
[ large medium ] | Deforestation in Rond�nia State, Brazil, 1988-2005
context
of image |
no thumbnail>
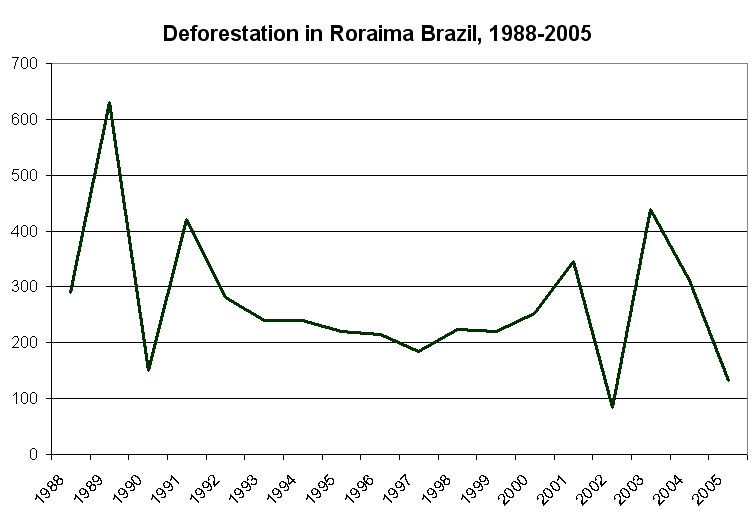
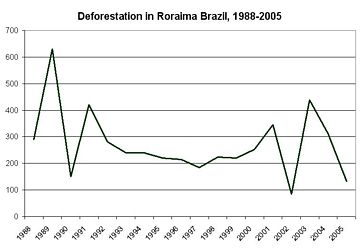
[ large medium ] | Deforestation in Roraima State, Brazil, 1988-2005
context
of image |
no thumbnail>
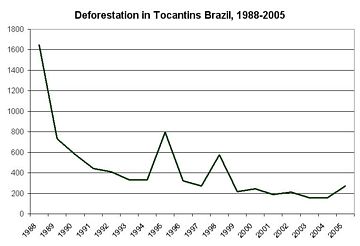
[ large medium ] | Deforestation in Tocantins State, Brazil, 1988-2005
context
of image |
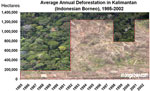
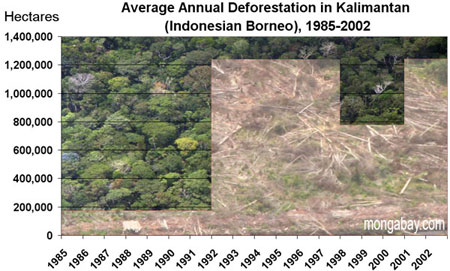
[ large medium small ] | Average annual deforestation rate in Kalimantan (Indonesian Borneo), 1985-2002
context
of image |
no thumbnail>
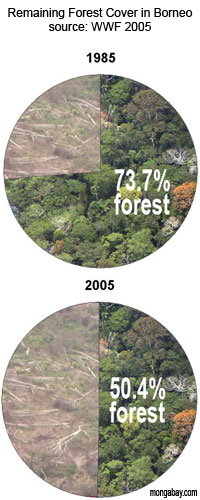
[ medium ] | Remaining forest cover in Borneo, 1985 and 2002
context
of image |
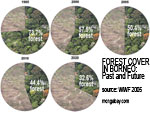
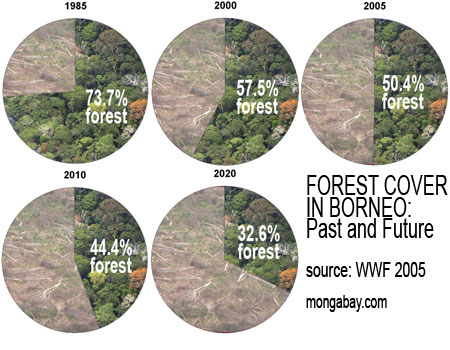
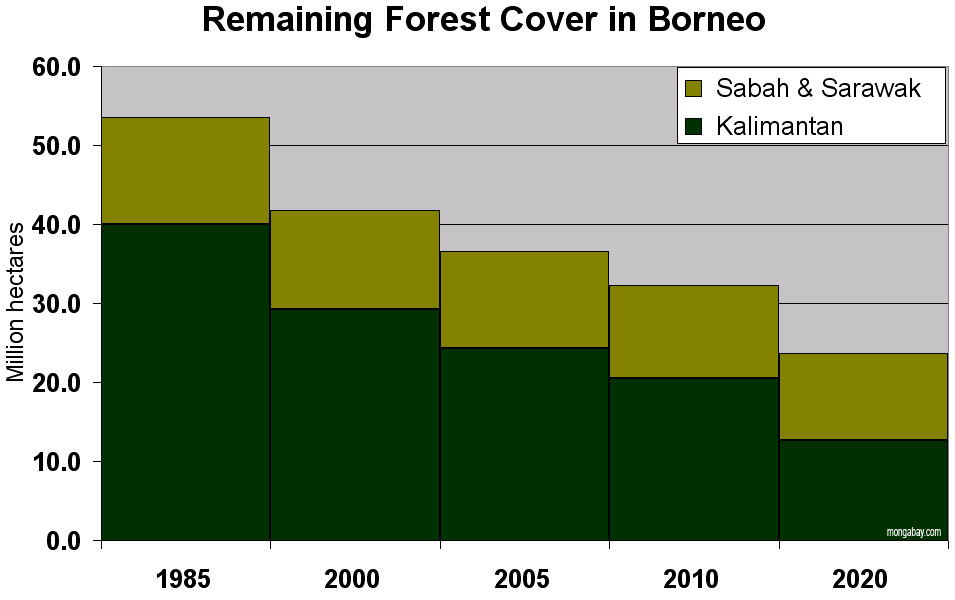
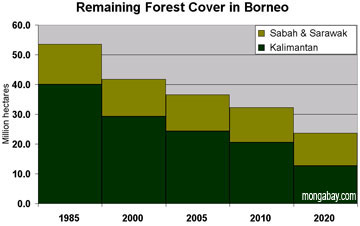
[ large medium small ] | Forest cover in Borneo, 1985-2020
context
of image |
no thumbnail>
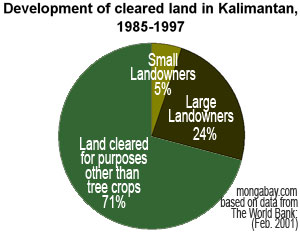
[ medium ] | Development of cleared land in Kalimantan, 1985-1997
Results of Forest Conversion. Derived from figures found in WWF 2005 and based on data from The World Bank: Indonesia: Environment and Natural Resource Management in a Time of Transitio, February 2001
context
of image |
no thumbnail>
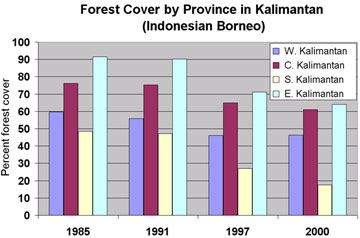
[ large medium ] | Forest cover in provinces of Kalimantan.
context
of image |
| FOREST COVER |
no thumbnail>
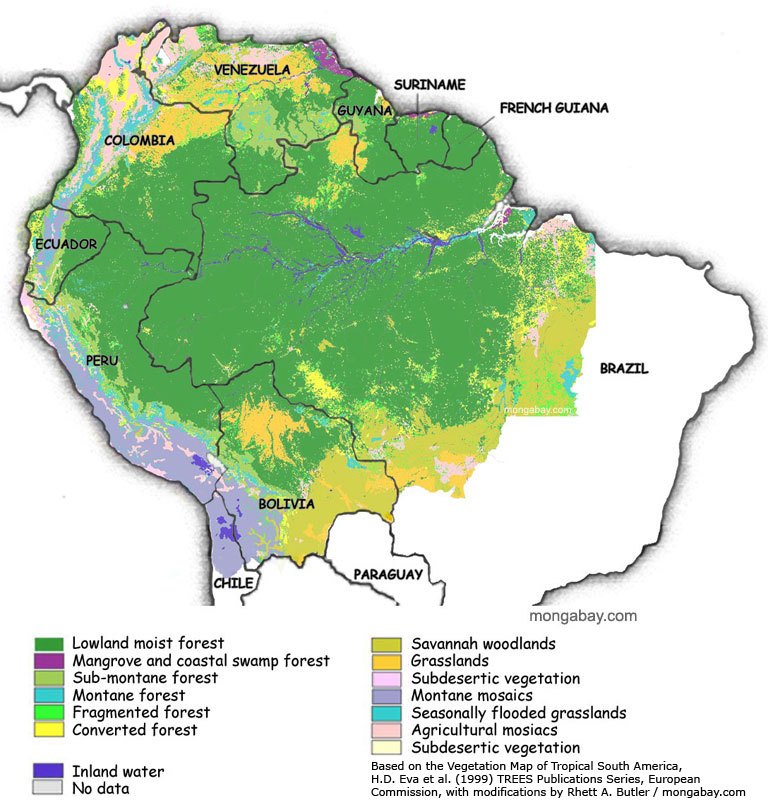
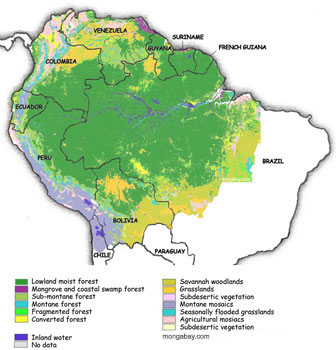
[ large medium ] | Forest cover and biomes in the Amazon region of South America
context
of image |
no thumbnail>
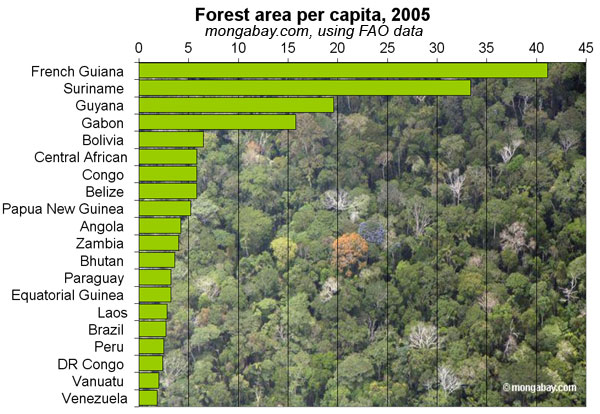
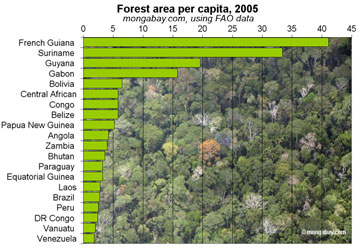
[ large medium ] | Forest cover per capita
Tropical countries with the highest amount of forest per capita in 2005 based on data from the U.N. Food and Agriculture Organization (FAO).
context
of image |
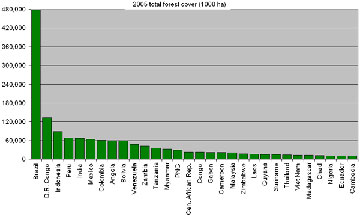
[ large medium small ] | 2005 total forest cover for tropical countries
2005 total forest cover for tropical countries, ranked in descending order
context
of image |
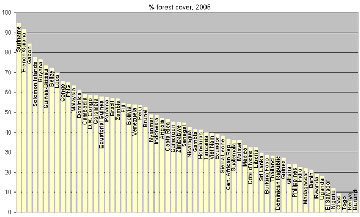
[ large medium small ] | 2005 percent forest cover for tropical countries
2005 percent forest cover for tropical countries, ranked in descending order
context
of image |
[ large medium small ] | Total area of primary forest cover, 2005
Statistics from 17 tropical countries for which the United Nations has somewhat reliable figures for primary forest cover. Total deforestation statistics typically fail to distinguish between general deforestation, reforestation through plantations, and the loss of biologically important primary forests (also called old-growth forests). Looking at primary forest loss figures for these countries reveals an alarming increase in deforestation of these endangered ecosystems.
context
of image |
no thumbnail>
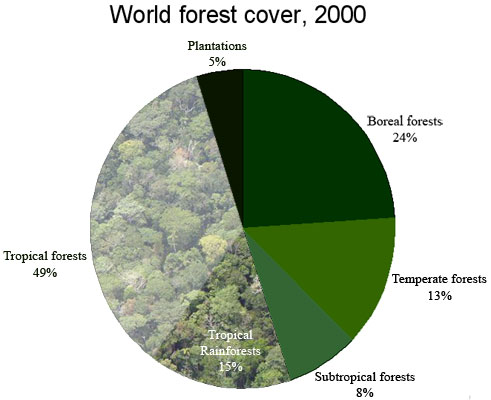
[ large ] | Chart showing percentage cover of world forests. Rainforests are a subsection of "Tropical forests".
context
of image |

[ large medium small ] | Forest cover in Borneo, 1985-2020
context
of image |
no thumbnail>
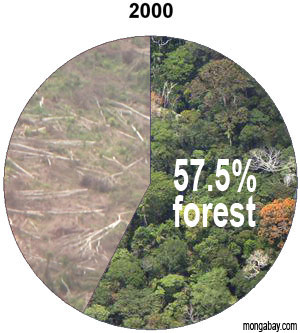
[ large ] | Borneo Forest Cover, 2000
context
of image |
no thumbnail>
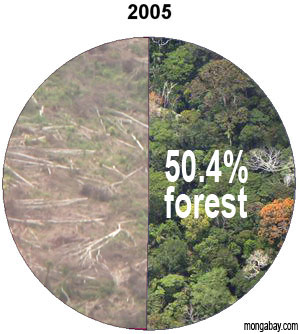
[ large ] | Borneo Forest Cover, 2005
context
of image |
no thumbnail>
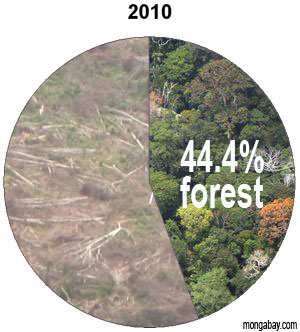
[ large ] | Borneo Forest Cover, 2010
context
of image |
no thumbnail>
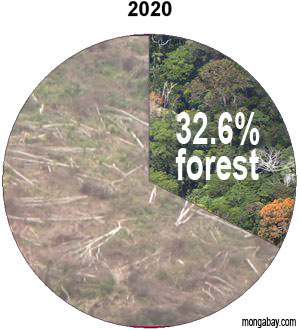
[ large ] | Borneo Forest Cover, 2020
context
of image |
no thumbnail>
[ large ] | Borneo Forest Cover, 1985
context
of image |
no thumbnail>
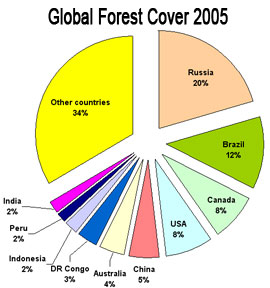
[ medium ] | Global forest cover 2005, by country
context
of image |
| BIODIVERSITY |
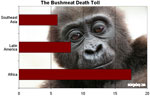
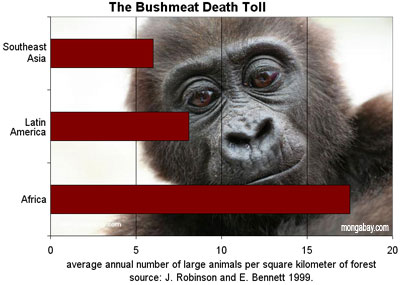
[ medium small ] | Number of animals killed in the bushmeat trade
context
of image |
no thumbnail>
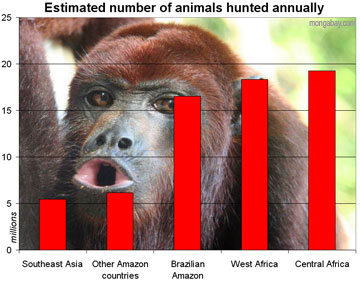
[ medium ] | Estimated number of animals hunted annually in the Amazon, Brazilian Amazon, West Africa, Central Africa, and Southeast Asia
context
of image |
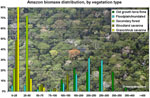
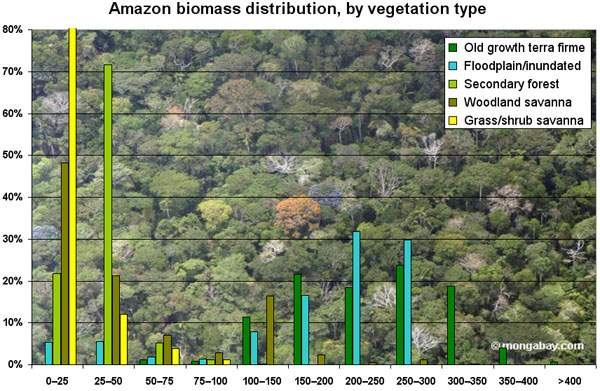
[ large medium small ] | Amazon biomass distribution, by vegetation type
The biomass range (metric tons per hectare) for general vegetation types in the Amazon Basin. The authors report the following distribution of vegetation category for the basin: Old growth terra firme forest (62.3% of the legal Amazon [(8 235 430 sq km]); Floodplain and inundated forest (4.19%); Secondary forest (1.67%); Woodland savanna (24.47%); and Grass/shrub savanna (4.79%). The authors report average biomass ranges as follows: Dense forest 272.5 Mt/ha, Open forest 200.2 Mt/ha, Bamboo forest 212.3 Mt/ha, Liana/dry forest 189.7 Mt/ha, Seasonal/deciduous forest 225.6 Mt/ha, and Varzea flooded forest 248.3 Mt/ha. Image produced by Rhett A. Butler using data from the authors.
context
of image |
no thumbnail>
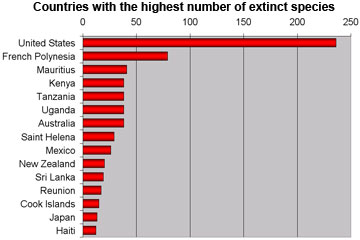
[ medium ] | Countries with the highest number of extinct species according to IUCN Red List data
context
of image |
no thumbnail>
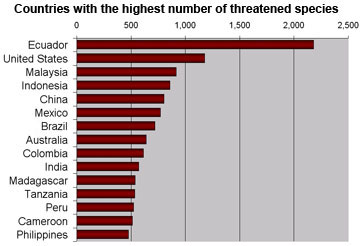
[ medium ] | Countries with the highest number of threatened species according to IUCN Red List data
context
of image |
no thumbnail>
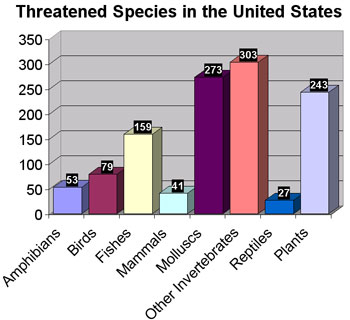
[ medium ] | Threatened species in the United States
context
of image |
no thumbnail>
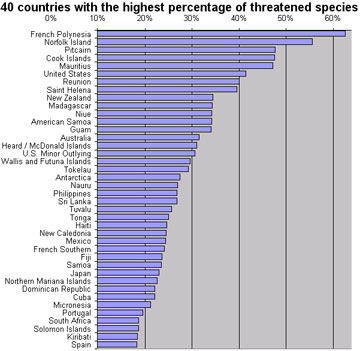
[ medium ] | Countries with the highest percentage of threatened species according to the IUCN Red List
Countries with the highest percentage of threatened species [(extinct+endangered+vulnerable)/(total assessed species-data deficient species)] derived from IUCN 2006 data. The United States ranks sixth at 41 percent, New Zeland ninth (34%), Madagascar tenth (34%), Australia fourteenth (32%), and Japan 31st (23%).
context
of image |
no thumbnail>
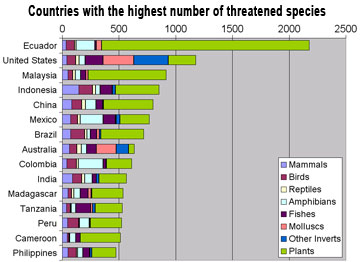
[ medium ] | Countries with the highest number of threatened species
Countries with the highest number of threatened species according to 2006 IUCN Red List data. The chart includes species listed as Critically Endangered (CR), Endangered (EN) or Vulnerable (VU) by IUCN and lists mammals, birds, reptiles, amphibians, fishes, mollusks, other invertebrates, and plants in the totals.
context
of image |
no thumbnail>
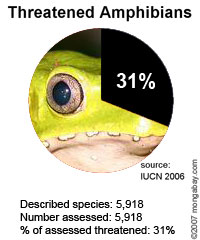
[ medium ] | Percent of amphibians threatened with extinction according to IUCN
context
of image |
no thumbnail>
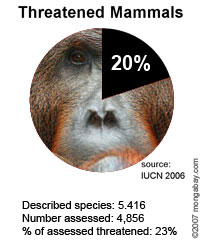
[ medium ] | Percent of mammals threatened with extinction according to IUCN
context
of image |
no thumbnail>
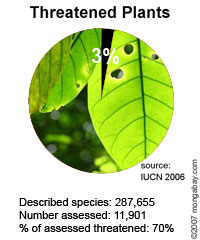
[ medium ] | Percent of plants threatened with extinction according to IUCN
context
of image |
no thumbnail>
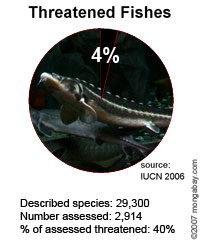
[ medium ] | Percent of fish threatened with extinction according to IUCN
context
of image |
no thumbnail>
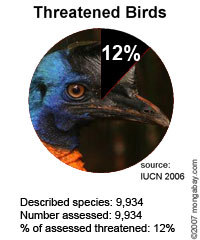
[ medium ] | Percent of birds threatened with extinction according to IUCN
context
of image |
no thumbnail>
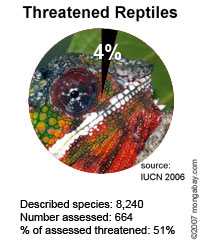
[ medium ] | Percent of reptiles threatened with extinction according to IUCN
context
of image |
| AGRICULTURE |
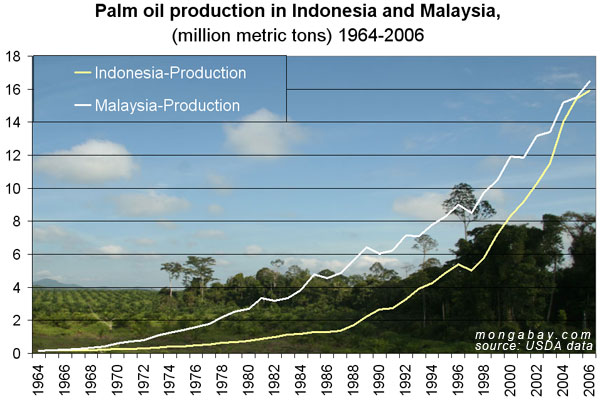
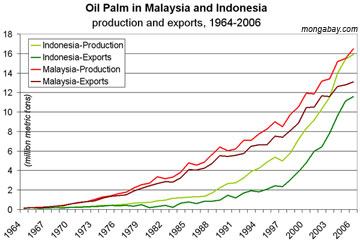
[ large medium small ] | Chart showing annual palm oil production by Malaysia and Indonesia from 1964-2006.
context
of image |
no thumbnail>
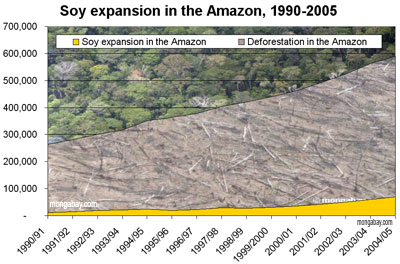
[ medium ] | Soy expansion in the Brazilian Amazon, 1990-2005
Total deforestation and area of soybean cultivation across states in the Brazilian Amazon. Overall soybean cultivation makes up only a small portion of deforestation, though its role is accelerating. Further, soybean expansion and the associated infrastructure development and farmer displacement is driving deforestation by other actors. Note: some soybean farms are established on already degraded rainforest lands and neighboring cerrado ecosystems. Therefore it would be inappropriate to assume the area of soybean planting represents its actual role in deforestation.
context
of image |
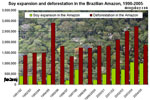
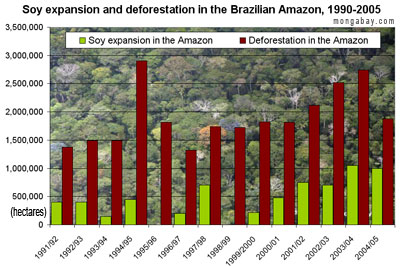
[ medium small ] | Soy expansion and deforestation in the Brazilian Amazon, 1990-2005
Annual deforestation rates and annual soy expansion for states in the Brazilian Amazon 1990-2005. Note that the 1995-1996 and 1998-1999 years were negative and do not show up on the chart. Graphs based on Brazilian government data.
context
of image |
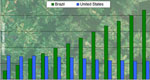
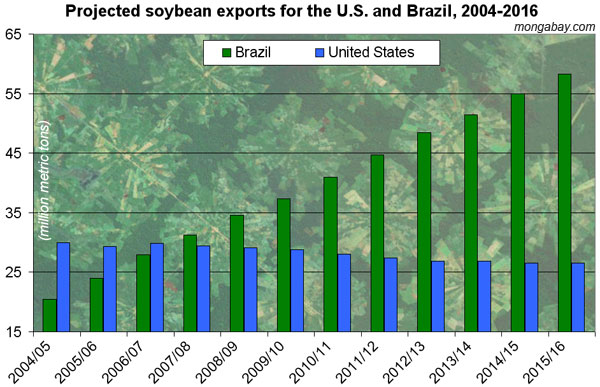
[ large medium small ] | Projected soybean exports for the U.S. and Brazil, 2004-2015
context
of image |
no thumbnail>
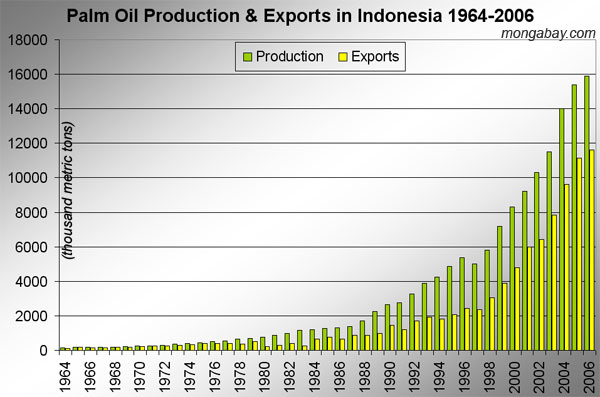
[ large medium ] | Chart showing annual palm oil production and exports by Malaysia and Indonesia from 1964-2006.
context
of image |
no thumbnail
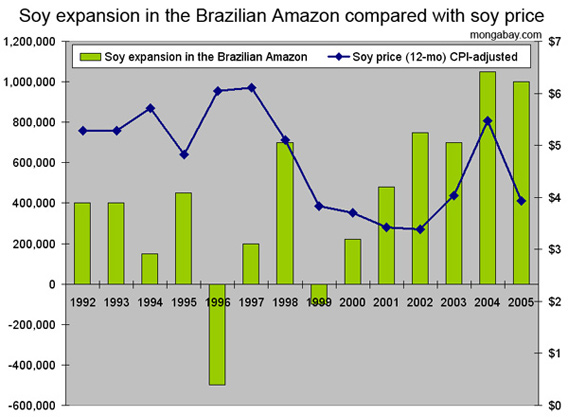
[ large] | Soy acreage expansion in the Brazilian Amazon compared with the soy price
Soy acreage expansion in the Brazilian Amazon compared with the price of soybeans (CPI-adjusted, 12-month moving average). All figures in hectares.
context
of image |
no thumbnail
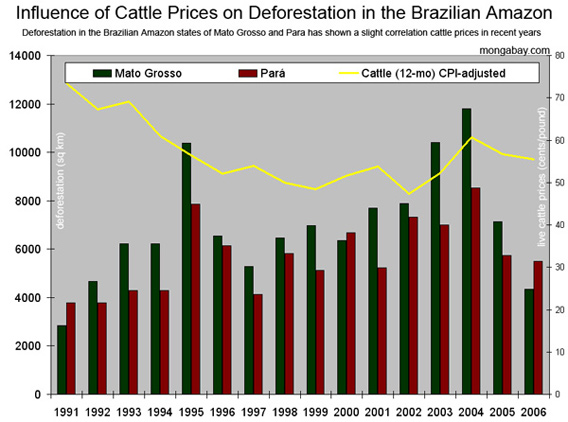
[ large] | Influence of live cattle prices on deforestation in the Brazilian Amazon
Influence of live cattle prices (CPI-adjusted, 12-month moving average) on deforestation in the Brazilian Amazon. While nearly two-thirds of Amazon clearing can be attributed to conversion for cattle pasture, deforestation in the states of Mato Grosso and Para has shown a only a slight correlation to cattle prices in recent years. This could be due, in part, to the use of cattle pasture for land speculation (land prices are rising faster than the value of cattle) and as a hedge against inflation and currency fluctuation. All figures in hectares (2.47 acres).
context
of image |
no thumbnail
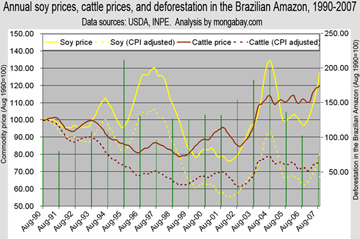
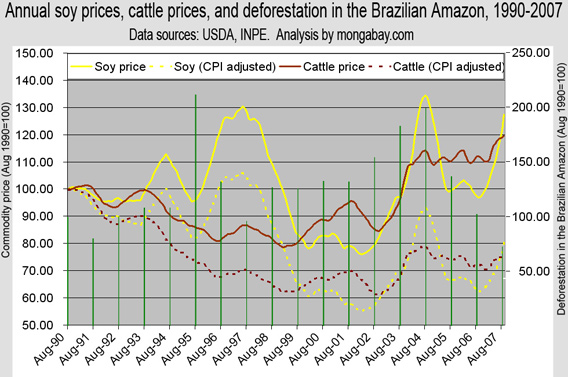
[ large medium] | Annual soy prices, cattle prices, and deforestation in the Amazon
The recent surge in soy and cattle prices could be driving an increase in forest fires. Annual deforestation figures for the 2007-2008 year will not be released until August of 2008, though new data for the 2007 burning season should be available by the end of the year.
context
of image |
no thumbnail
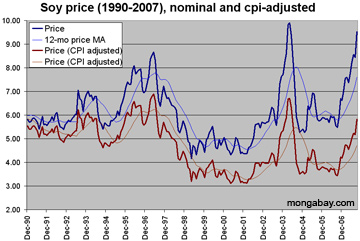
[ large medium] | Soy price, 1990-2007
Soy price, 1990-2007. Nominal and CPI-adjusted
context
of image |
no thumbnail
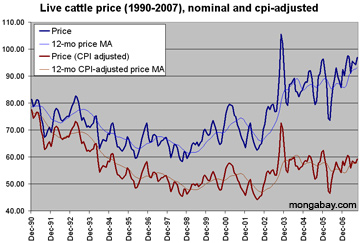
[ large medium] | Live cattle price, 1990-2007
Live cattle price, 1990-2007. Nominal and CPI-adjusted
context
of image |
no thumbnail>
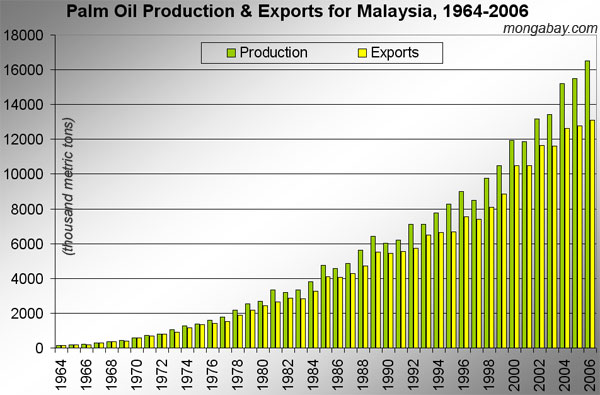
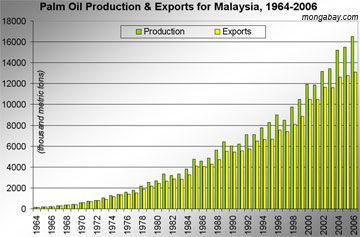
[ large medium ] | Chart showing annual palm oil production and exports for Malaysia from 1964-2006.
context
of image |
no thumbnail>
[ large medium ] | Chart showing annual palm oil production and exports for Indonesia from 1964-2006.
context
of image |
no thumbnail>
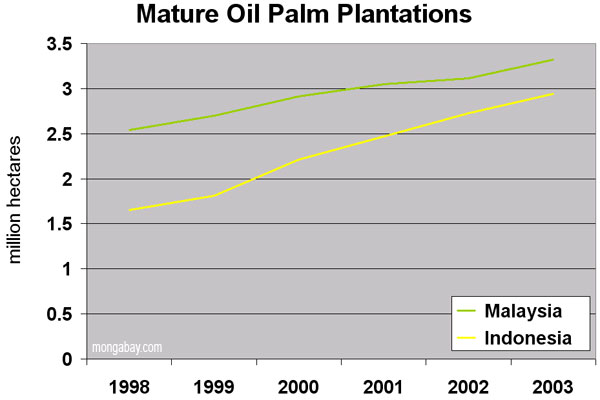
[ large medium ] | Growth of oil palm cultivation in Kalimantan and Malaysian Borneo.
context
of image |
no thumbnail>
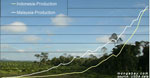
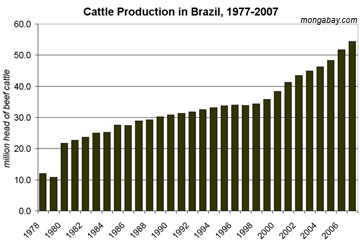
[ large medium ] | Cattle production in Brazil, 1977-2007
|
no thumbnail>
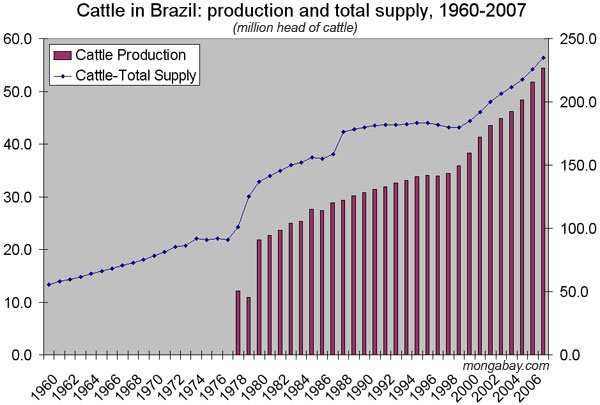
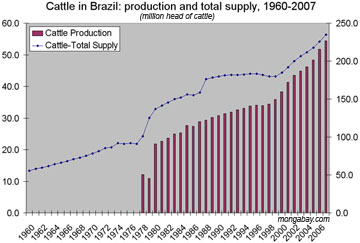
[ large medium ] | Production and total supply of cattle in Brazil, 1960-2007
|
no thumbnail>
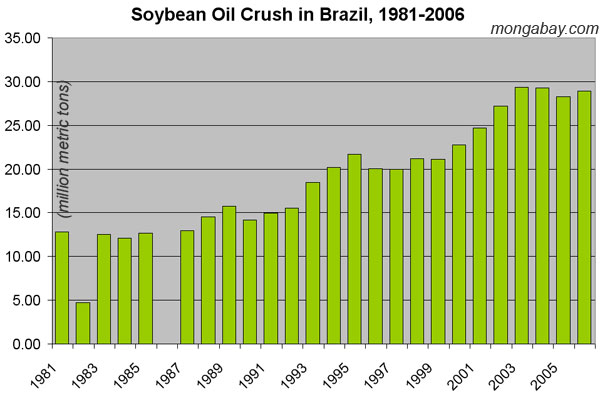
[ large medium ] | Soybean oil crush in Brazil, 1981-2006
context
of image |
no thumbnail>
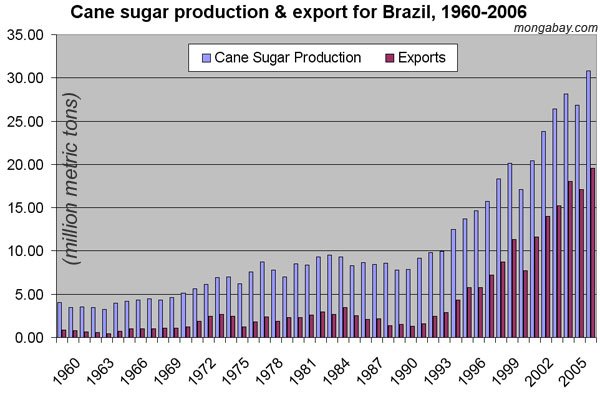
[ large medium ] | Sugar cane production & export for Brazil, 1960-2006
context
of image |
no thumbnail>
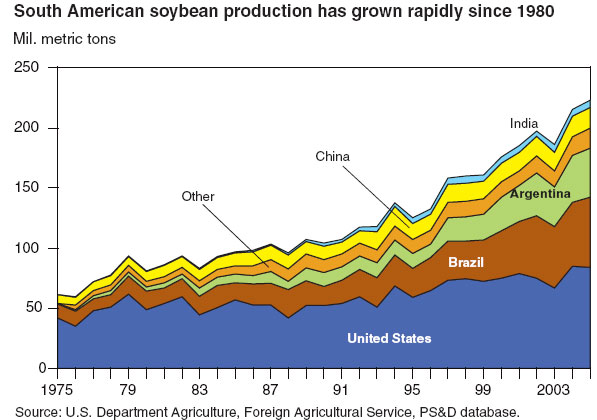
[ large medium ] | World soybean production, 1980-2003
context
of image |
no thumbnail>
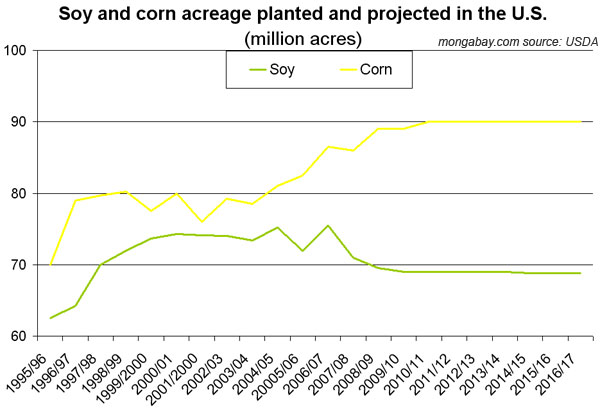
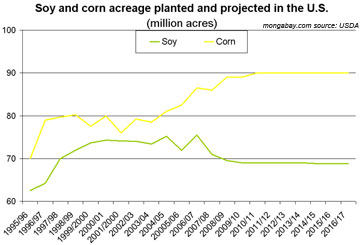
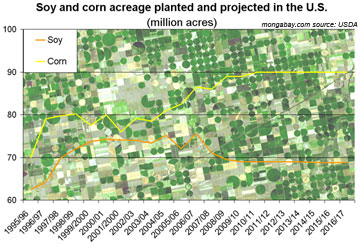
[ large medium ] | Soy and corn acreage planted and projected in the United States
context
of image |
no thumbnail>
[ large medium ] | Soy and corn acreage planted and projected in the United States
context
of image |
no thumbnail>
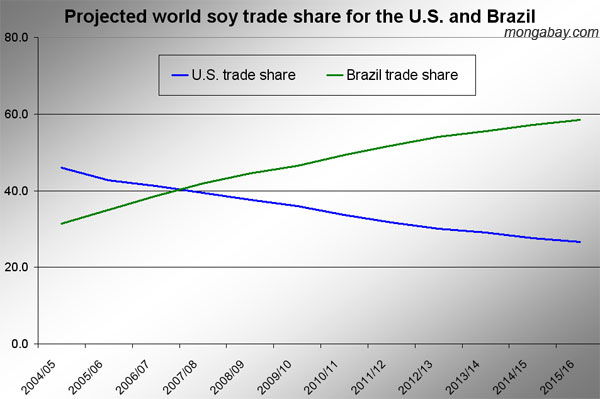
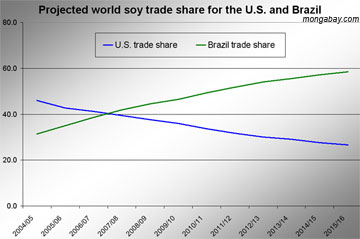
[ large medium ] | Forecast world soy trade market share for the U.S. and Brazil, 2004-2016
context
of image |
no thumbnail>
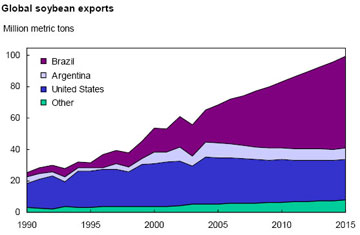
[ medium ] | World soybean exports, 1990-2015
context
of image |
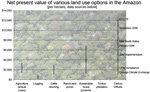
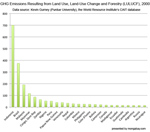
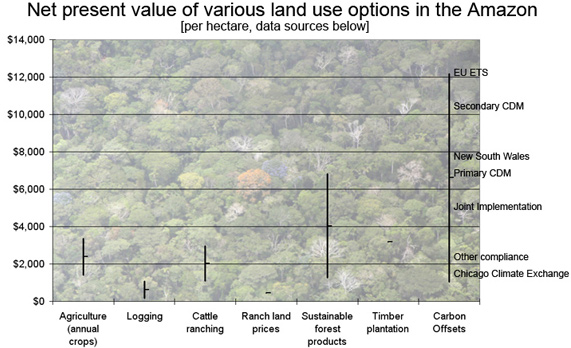
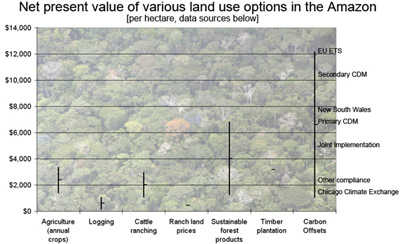
[ large medium small ] | Net present value of various land use options in the Amazon
Carbon offsets versus other types of land use in the Amazon rain forest.
context
of image |
no thumbnail
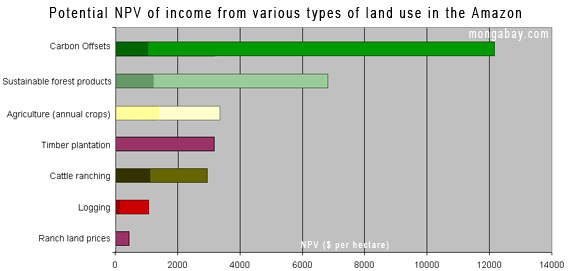
[ large] | Potential NPV of income from various types of land use in the Amazon
Carbon offsets versus other types of land use in the Amazon rain forest.
context
of image |
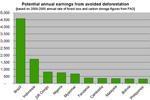
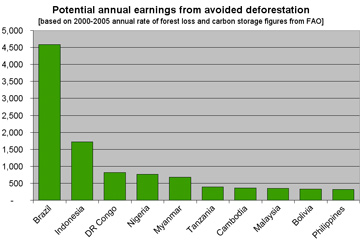
[ medium small ] | Potential annual earnings from Avoided Deforestation
Potential earnings from avoided deforestation, based on annual rate of forest loss in selected countries from 2000 to 2005 and average carbon storage values from FAO. Carbon is assumed to be priced at $5 per metric ton of carbon dioxide equivalent.
context
of image |
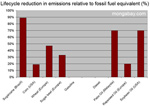
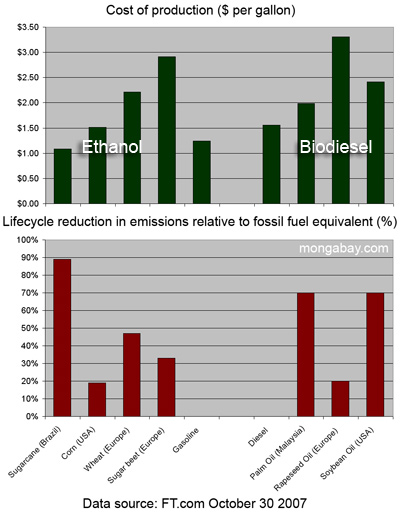
[ medium small ] | Biofuel production costs and lifecycle emissions reduction
Sugarcane, corn, wheat, sugar beets (ethanol); gasoline; diesel; palm oil, rapeseed oil, soybean oil
context
of image |
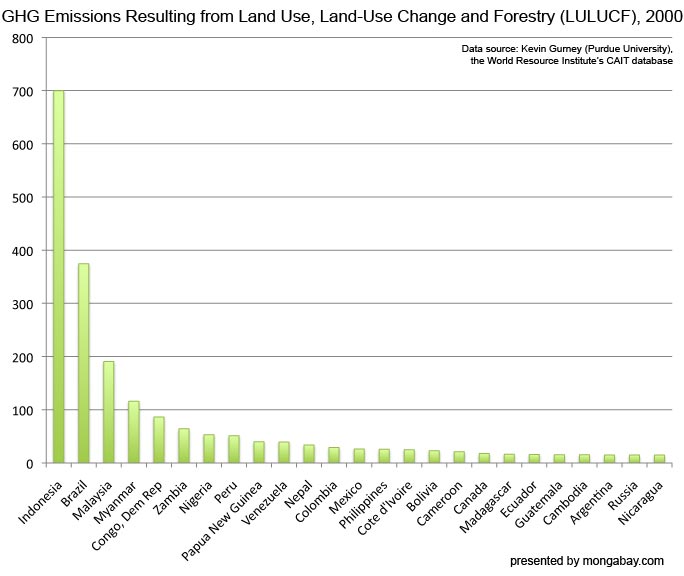
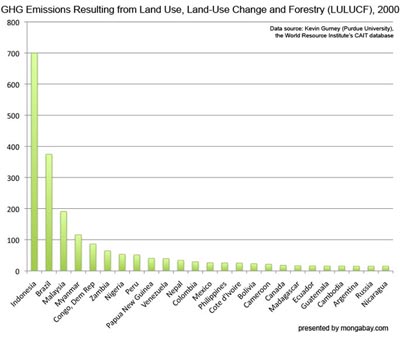
[ large medium small ] | Greenhouse gas emissions resulting from Land Use, Land-Use Change and Forestry (LULUCF)
LULUCF includes deforestation and forest degradation. The REDD mechanism seeks to reduce these emissions by compensating tropical countries for conserving their forests.
context
of image |
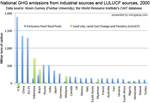
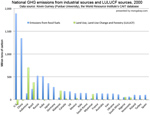
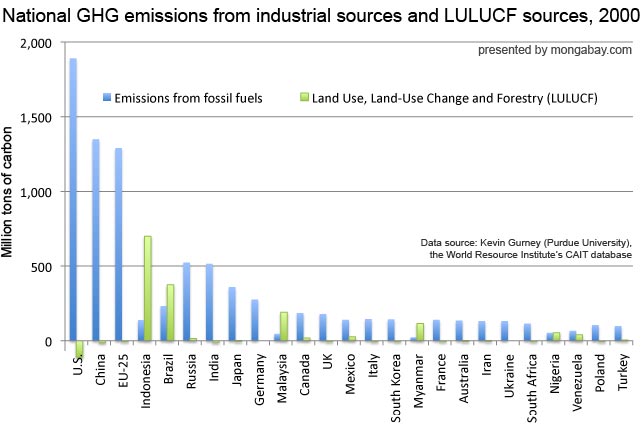
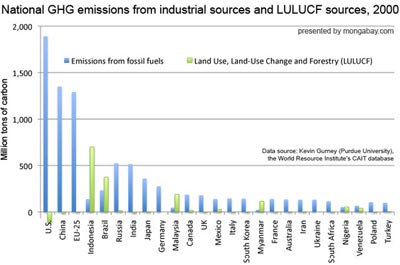
[ large medium small ] | National GHG emissions from industrial sources (electricity generation, transportation, buildings, etc) and LULUCF, 2000
Note that some countries have negative emissions from LULUCF meaning they these sources are a net carbon sink. Also note that the E.U. is listed in addition to its individual member countries.
context
of image |
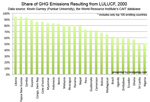
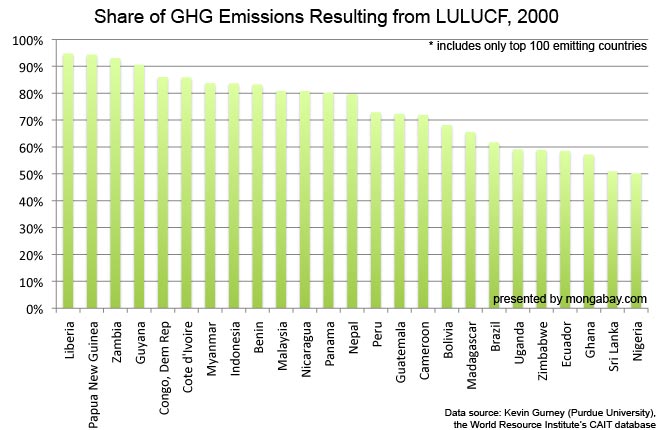
[ large medium small ] | Share of GHG emissions resulting from LULUCF in the year 2000
This chart includes on the 100 top emitting countries.
context
of image |
[ large medium small ] | National GHG emissions from industrial sources (electricity generation, transportation, buildings, etc) and LULUCF, 2000
Note that some countries have negative emissions from LULUCF meaning they these sources are a net carbon sink. Also note that the E.U. is listed in addition to its individual member countries.
context
of image |


